This page is not compatible with Internet Explorer.
For security reasons, we recommend that you use an up-to-date browser, such as Microsoft Edge, Google Chrome, Safari, or Mozilla Firefox.
What's New in VGMETROLOGY
Discover the Exciting New Capabilities of Version 3.4 (as of February 2021, Version 3.4.5)
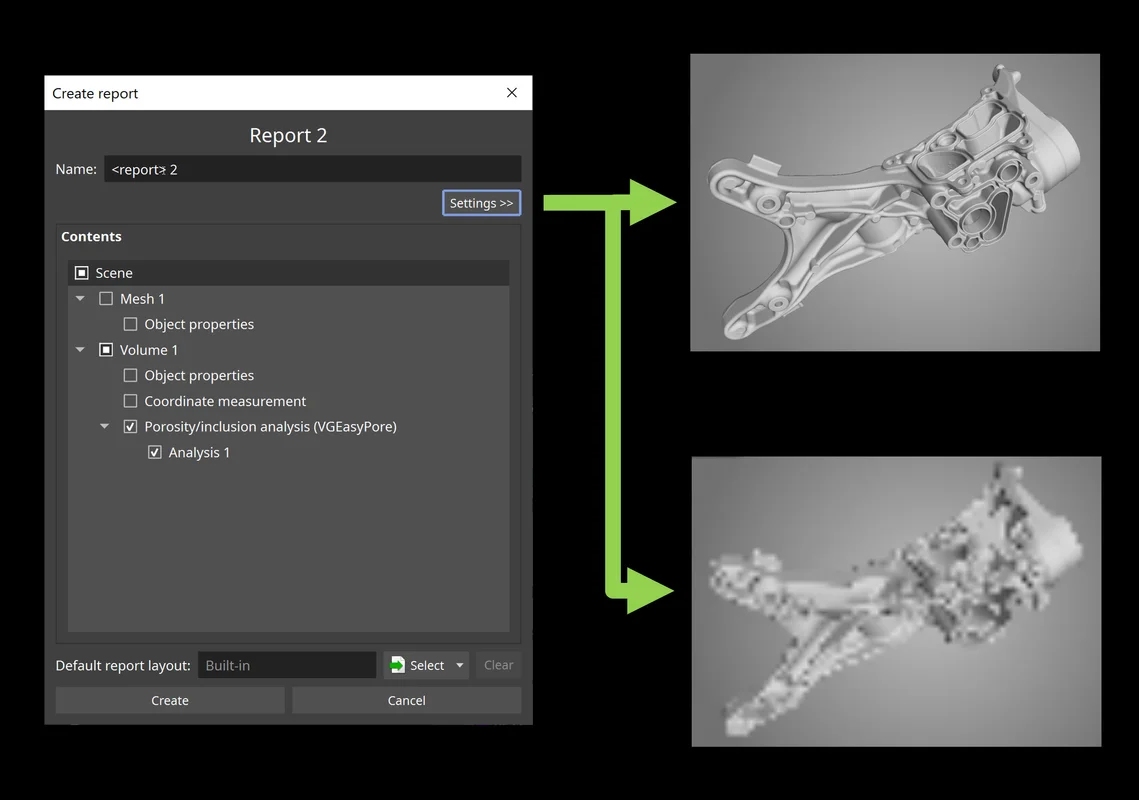
Image Generation Settings in New Reporting (New in 3.4.5)
Custom image generation settings, such as for resolution and opacity mapping, are now also available for the new integrated reporting function and can be specified for individual objects or for the entire report. This way, image creation is consistent even in automation scenarios and reporting the same content using different settings is easily possible.
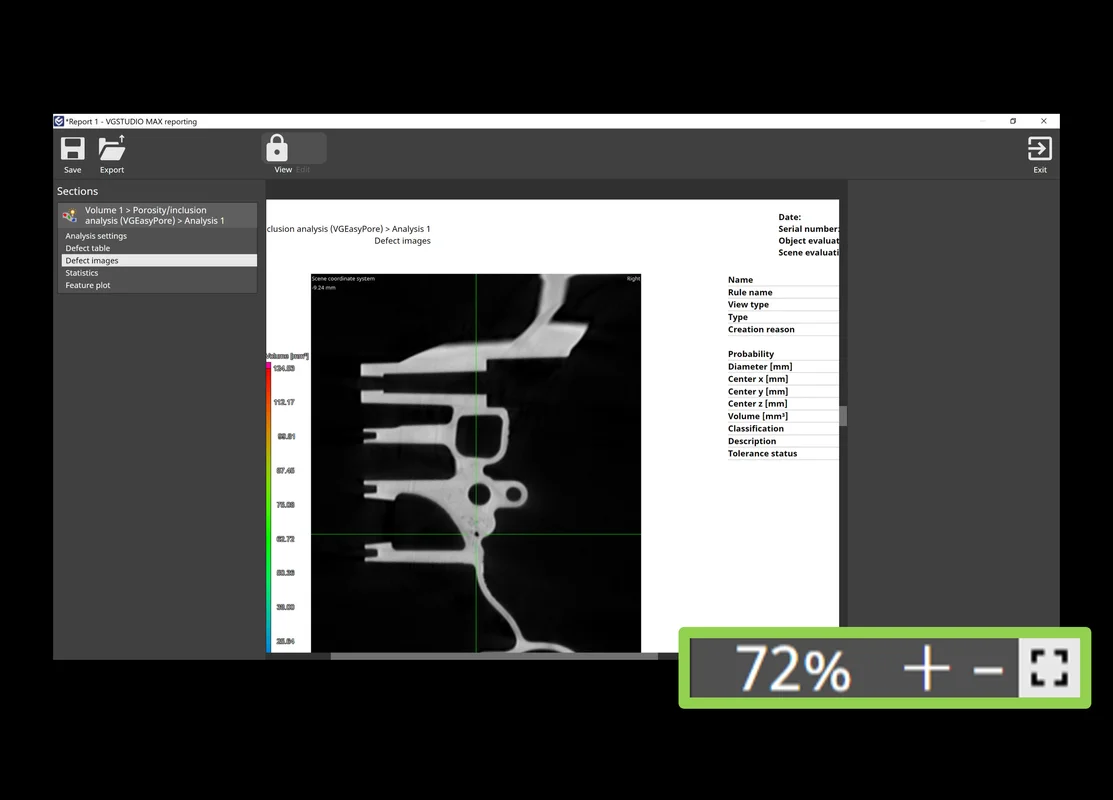
Zoom Function in Report Editor (New in 3.4.5)
The new zoom function in the WYSIWYG (What You See Is What You Get) editor lets you easily fit relevant content to your screen while viewing or editing a report. It automatically scales the report pages to fit the available space or allows you to set a manual zoom level depending on the level of detail you want to see.
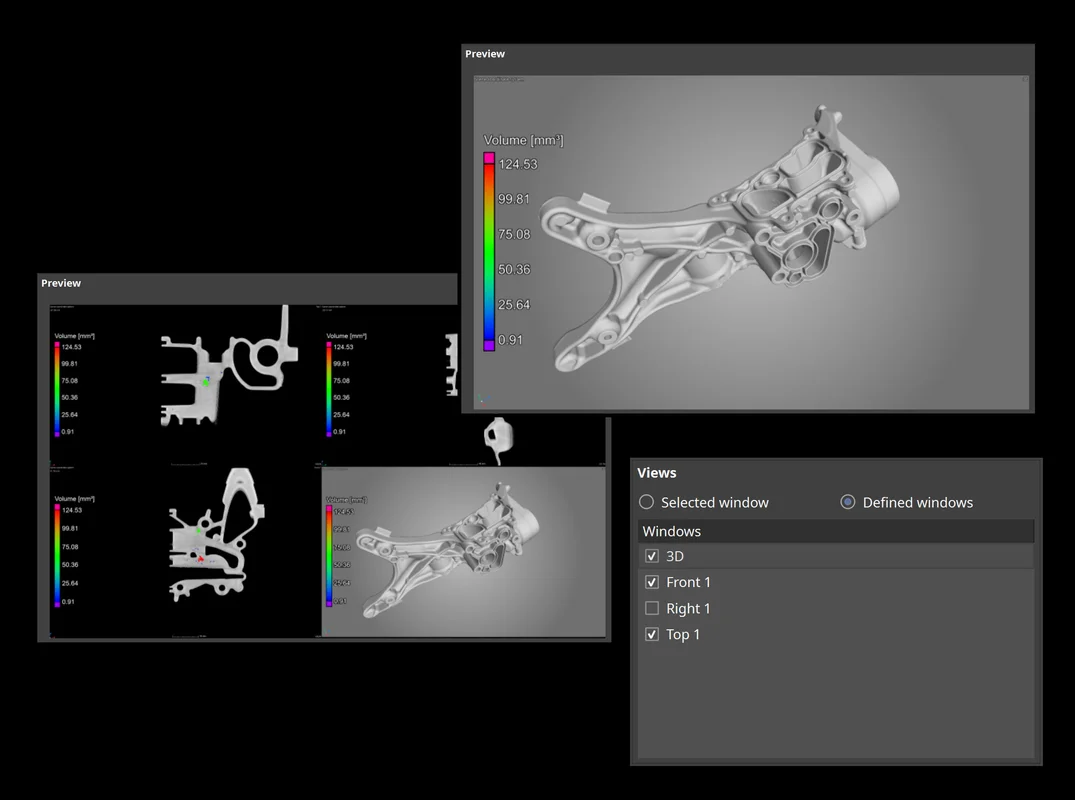
Window Options when Saving Images (New in 3.4.5)
A new save image option allows you to save either the currently selected workspace window or a manually defined combination of workspace windows. Depending on your manual inspection workflow, one or the other might be more convenient for you—the new option in the dialog allows for both while keeping the shortcut and automatic storage of other image settings unchanged.
New Integrated Reporting (New in 3.4.4)
Completely new integrated reporting now lets you edit and view reports in Volume Graphics applications exactly as they will appear in the PDF, customize them, automate their creation, and store them directly in your .vgl project. The new integrated reporting function is a fast way to create presentable .pdf reports without having to switch to external software like Microsoft Excel and is available throughout our products, even in our free viewer applications myVGL and VGMETROLOGY VIEWER. And because report creation and export are macro-recordable, the new reporting is also available for automation and VGinLINE.
WYSIWYG Report Editor (New in 3.4.4)
The new WYSIWYG (What You See Is What You Get) editor as part of the completely new integrated reporting function makes it easy to create a more digestible view of your project data. You can create reports that contain all or a subset of the reportable content in the scene and customize the displayable content, such as images, table columns, or page layouts. Additionally, data sections in the report, like selected metainformation, volume information, analysis settings, or result images, can be reordered or removed altogether. Once a custom layout has been created, it can be stored and reused when similar content is to be reported.
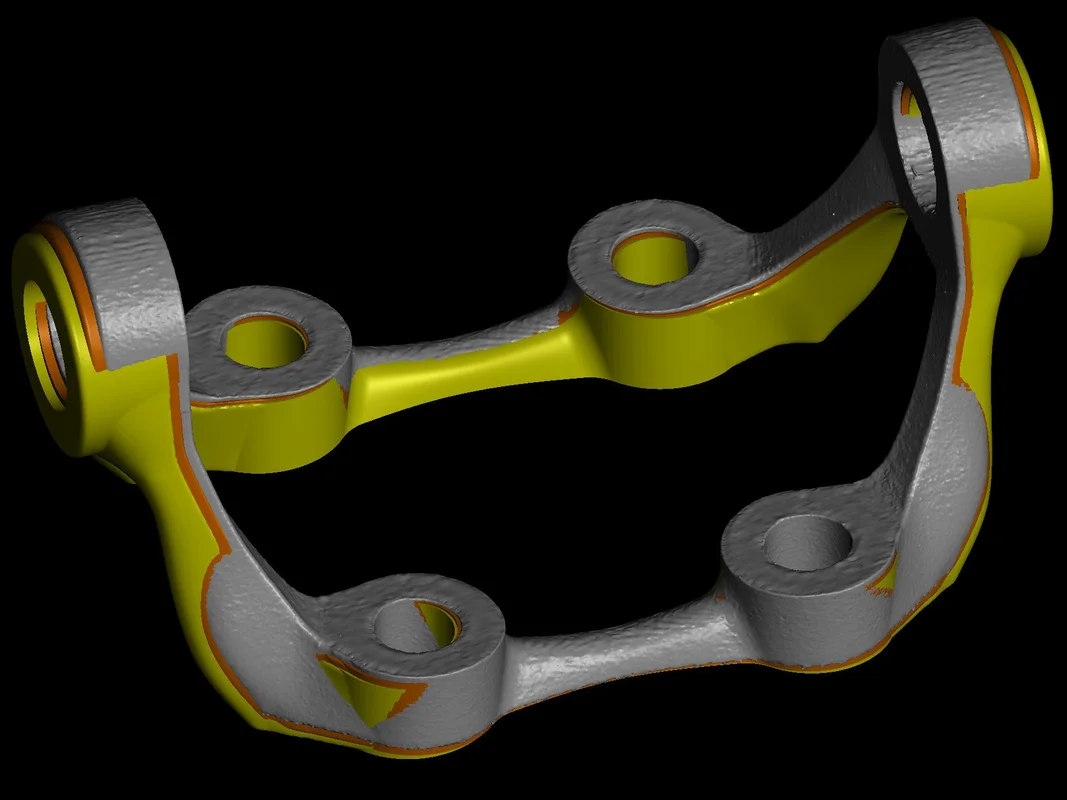
Compensation Mesh for Additive Manufacturing (New in 3.4.3)
You can now easily create a surface mesh that compensates for the difference between the actual object and a reference object—directly from the Manufacturing Geometry Correction module. This saves you time by reducing the number of iterations as opposed to a trial-and-error approach for the final printing geometry optimization. Compensate the mesh sent to a 3D printer to eliminate deviations in the nominal geometry caused by distortions. Such distortions are inherent in the 3D printing process and may even remain after a previous optimization based on a 3D printing simulation.
Manual Annotations for Geometric Tolerances (New in 3.4.3)
You can now indicate numerical deviations at certain positions on the surface in addition to visualizing the tolerance deviations via color overlays by creating annotations for geometric tolerances. The annotations are shown in the Scene Tree as well as in the new reportable annotation table in the "CM reporting" dialog. The "Features" tab in the coordinate measurement reporting is also expanded by an additional annotation table, which shows the annotations for the currently selected feature. Annotations can be created either manually at the desired positions in the views or by pasting pre-defined positions from the clipboard into the annotation table of a certain feature. The annotations can also be pasted between different geometric tolerances and are part of coordinate measurement and evaluation templates. The appearance (e.g., font or cursor sizes) can be specified in the preferences.
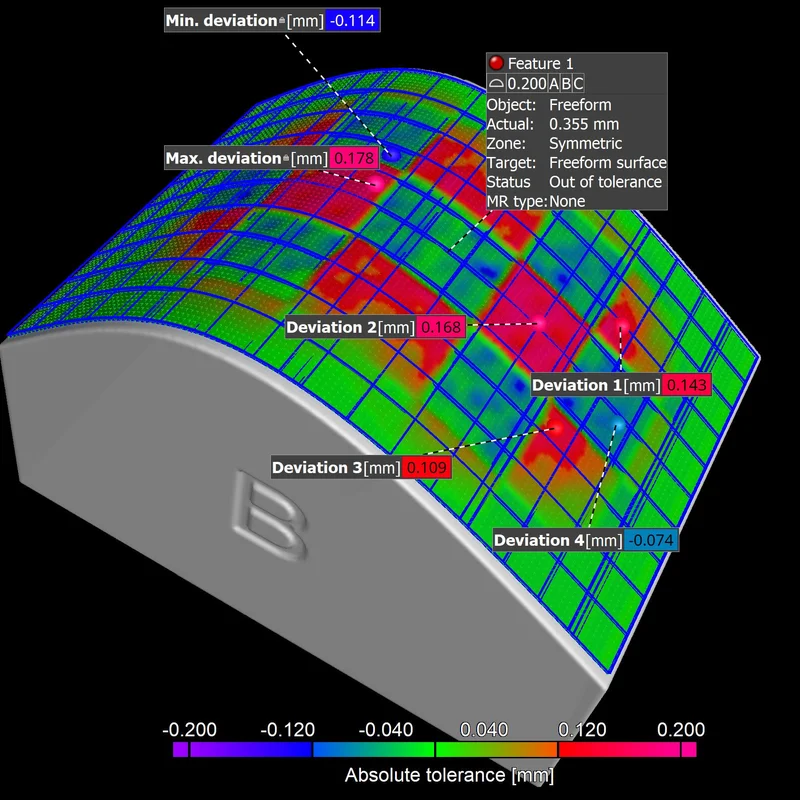
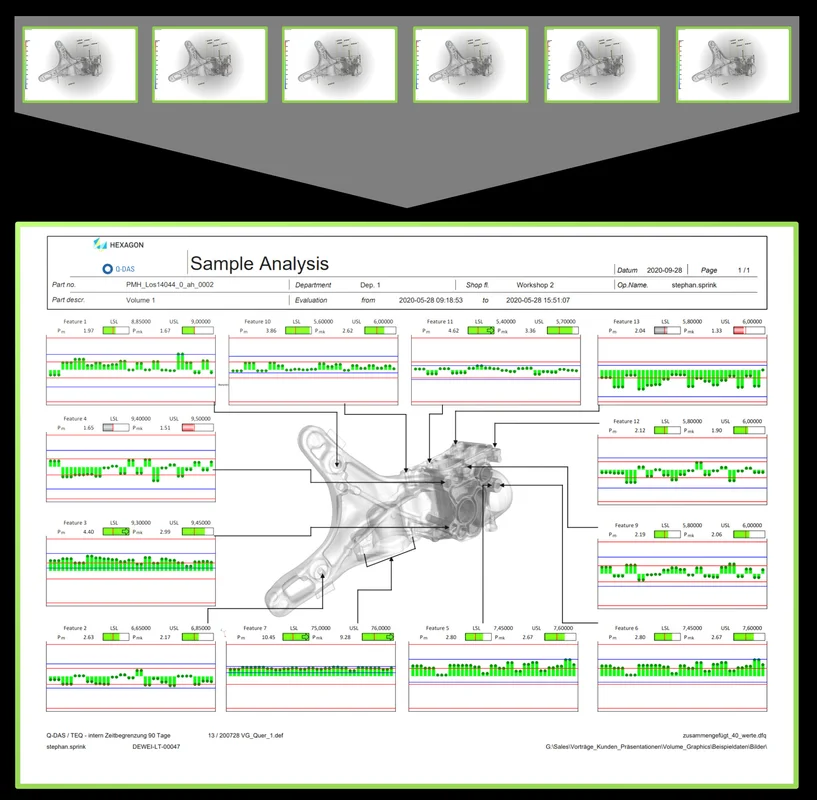
Image Support for Q-DAS Export (New in 3.4.3)
Exporting measurement results to Q-DAS software qs-STAT for statistical process control now includes associated images that indicate the position of the measured features on the part. These images can then be used to set up a report view in qs-STAT, which will be populated with the results of many measured parts. Visualizing measurement time series and the position of the measured features on the part make it easier to evaluate results, for example to locate a potential need for an injection molding tool correction during machine qualification or while production is running.
Faster Access to Visualization Options (New in 3.4.3)
Change transparency and colors of volumes, CAD objects, and meshes faster by accessing the most frequently used visualization options in one compact icon bar.
Log File for PMI Data Translation (New in 3.4.3)
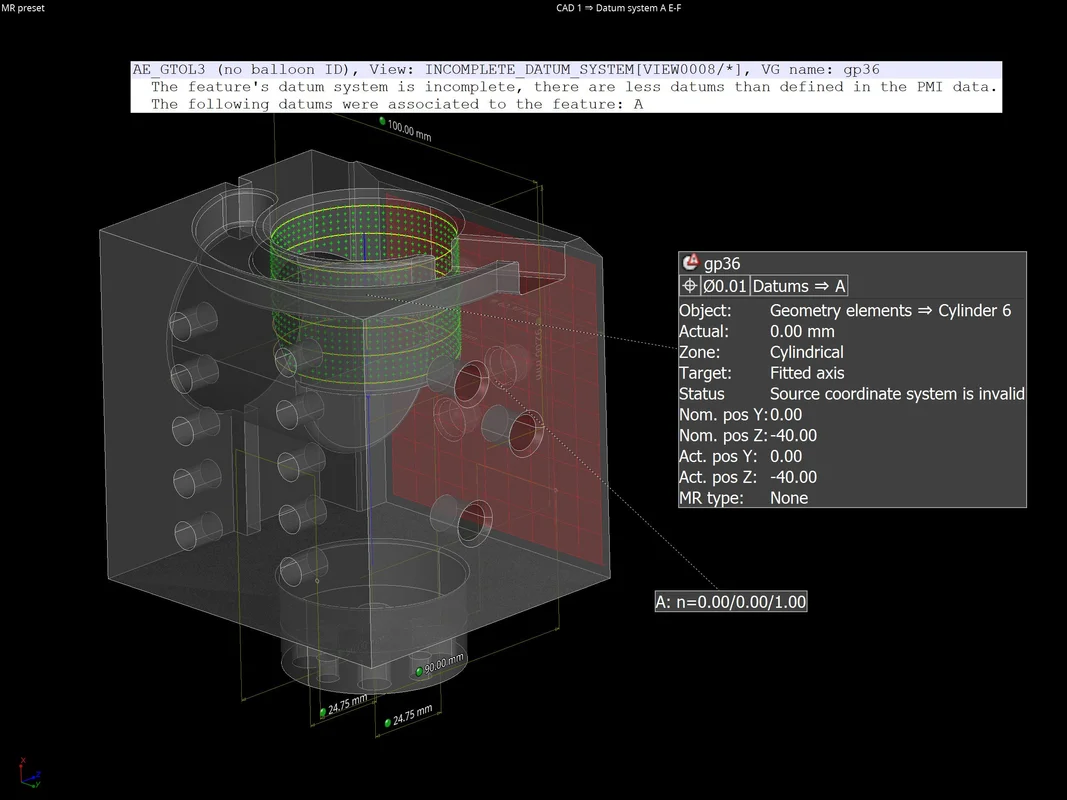
The software now creates a log file to report problems that occurred in the PMI data translation step when importing advanced CAD files. Sometimes, it is not possible to translate all measurements from PMI data into a coordinate measurement template, like when data is incomplete or ambiguous. Often, these problems can be avoided in the originating CAD system by providing necessary semantic information for the PMI data. The log file now allows you to easily detect well-known problems by identifying problematic CAD entities and giving you tips on how to resolve these issues.
Intersection Points of Circle and Surface (New in 3.4.3)
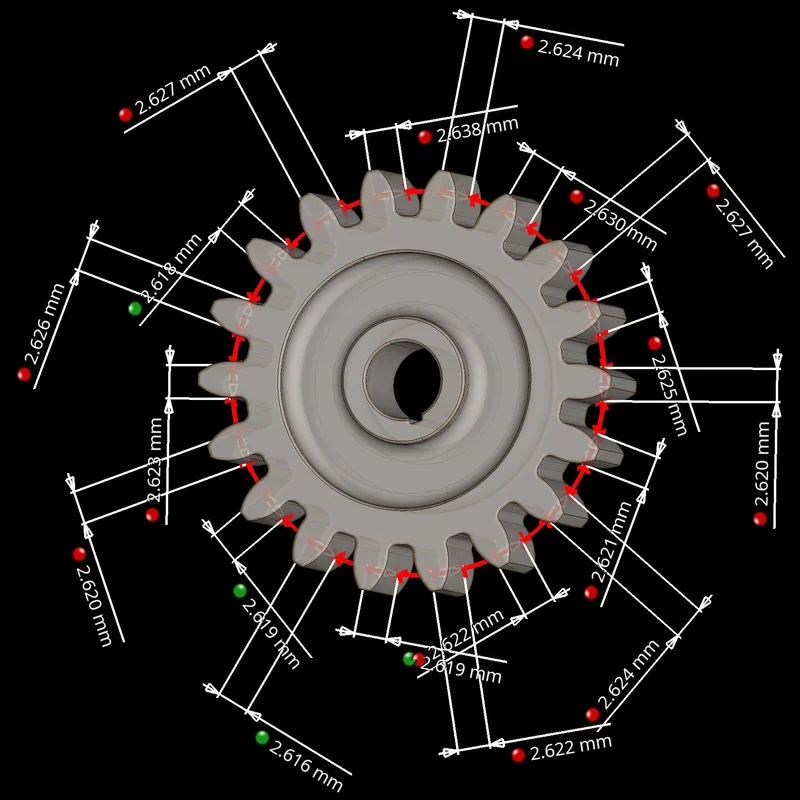
Use the new intersection function on circle elements to easily detect the intersection point of a circle and the surface of a part, which is required for certain measurement tasks or alignments (e.g., on gears or other rotational structures). The maximum number of result points as well as their order can be specified. Moreover, the intersection points are also part of coordinate measurement templates, which allows them to be easily transformed and applied in a pattern.
Create ROI from Wall Thickness Range
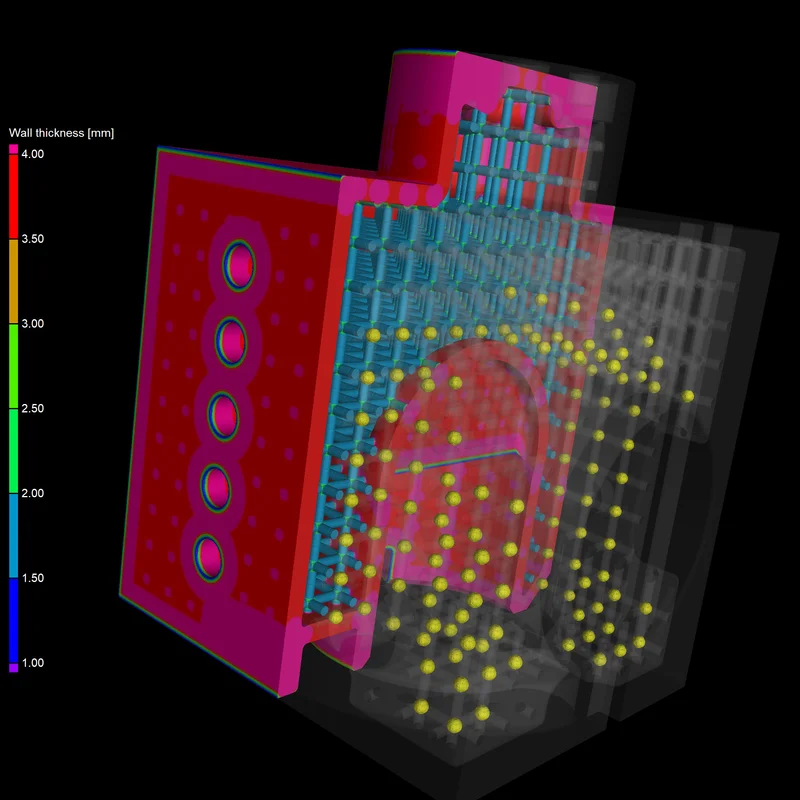
To separate thick from thin structures, you can now create a ROI from a wall thickness range. This can be very useful for when you're segmenting thin struts and thicker nodes in additively manufactured lattice structures or performing a porosity analysis to a specific region. Moreover you can use it to segment trabecular and cortical bone easily. Because separation by wall thickness is now only one click away, you no longer need to use manual segmentation tools to separate any structures with varying thicknesses.
Manual Compensation Offset for Manufacturing Geometry Correction (New in 3.4.3)
You can now approach the perfect tool (mold) shape slowly without running the risk of removing too much material. Just use the new additional manual compensation offset that's been added to the automatically calculated tool offset. This helps you easily decrease or increase the tool offset derived from the nominal/actual comparison between the part CAD model and the tool CAD model.
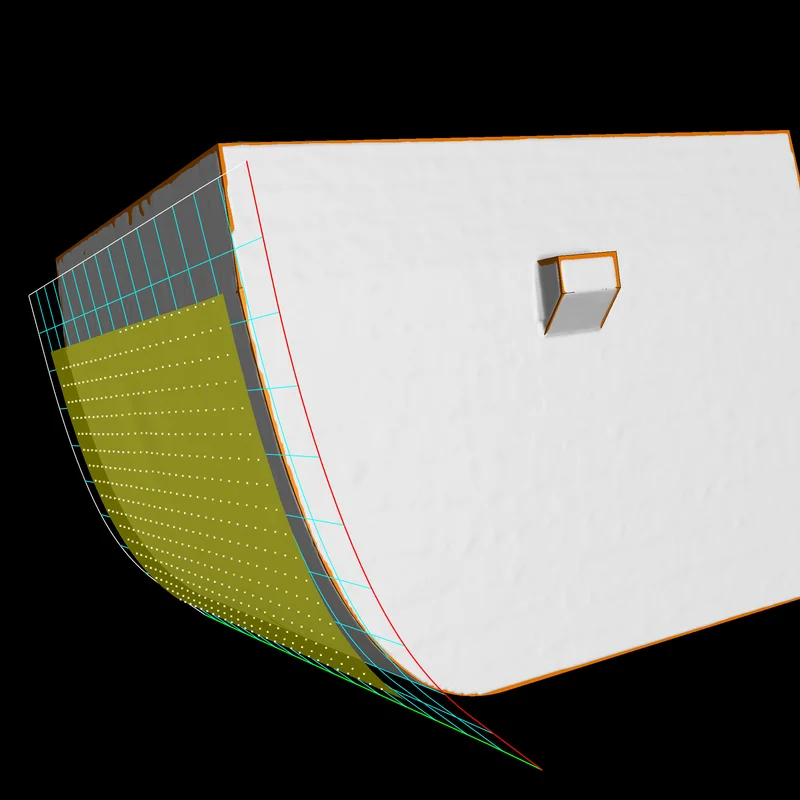
Visualization of Compensated Points in Manufacturing Geometry Correction (New in 3.4.3)
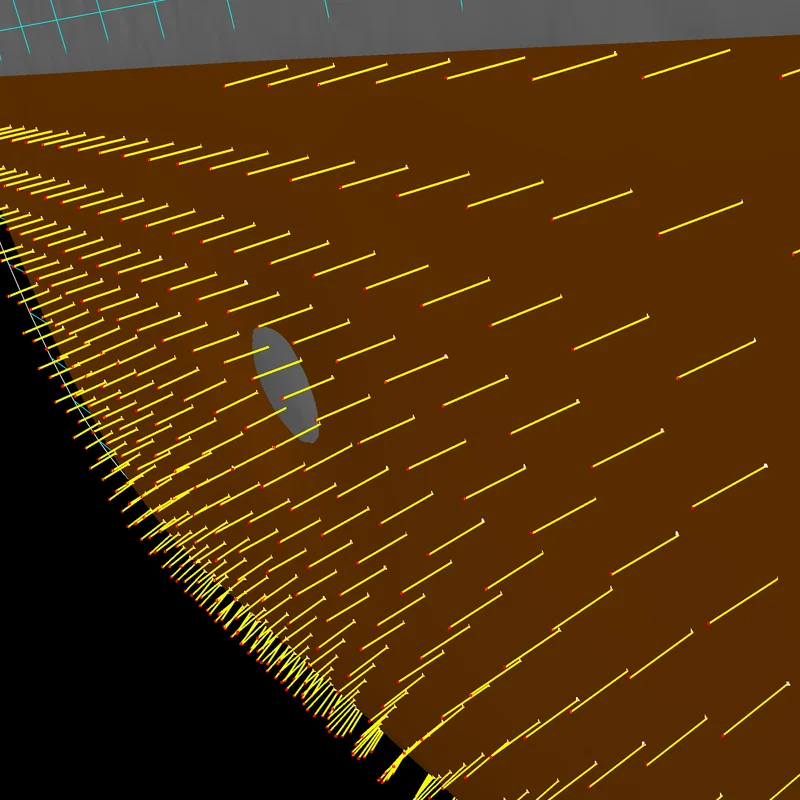
Visualize the compensated points as you apply deviation compensation and tool correction. This allows you to see if the sampling points were compensated correctly and if the fitted surface follows the compensated fit points well.
Convert ROI to CAD for Easy Reverse Engineering (New in 3.4.3)
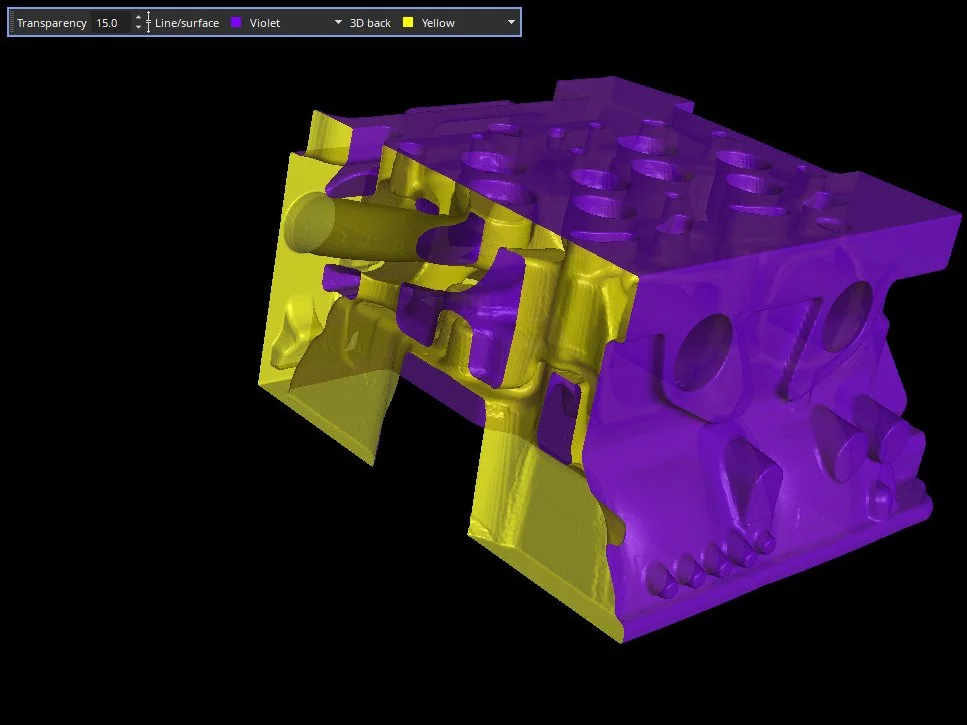
You can now convert ROIs into CAD models, which can come in handy when you want to create CADs from complicated freeform geometries—such as water cooling channels of an engine or a segment of apart. Now, these complex areas can be easily represented by ROIs.
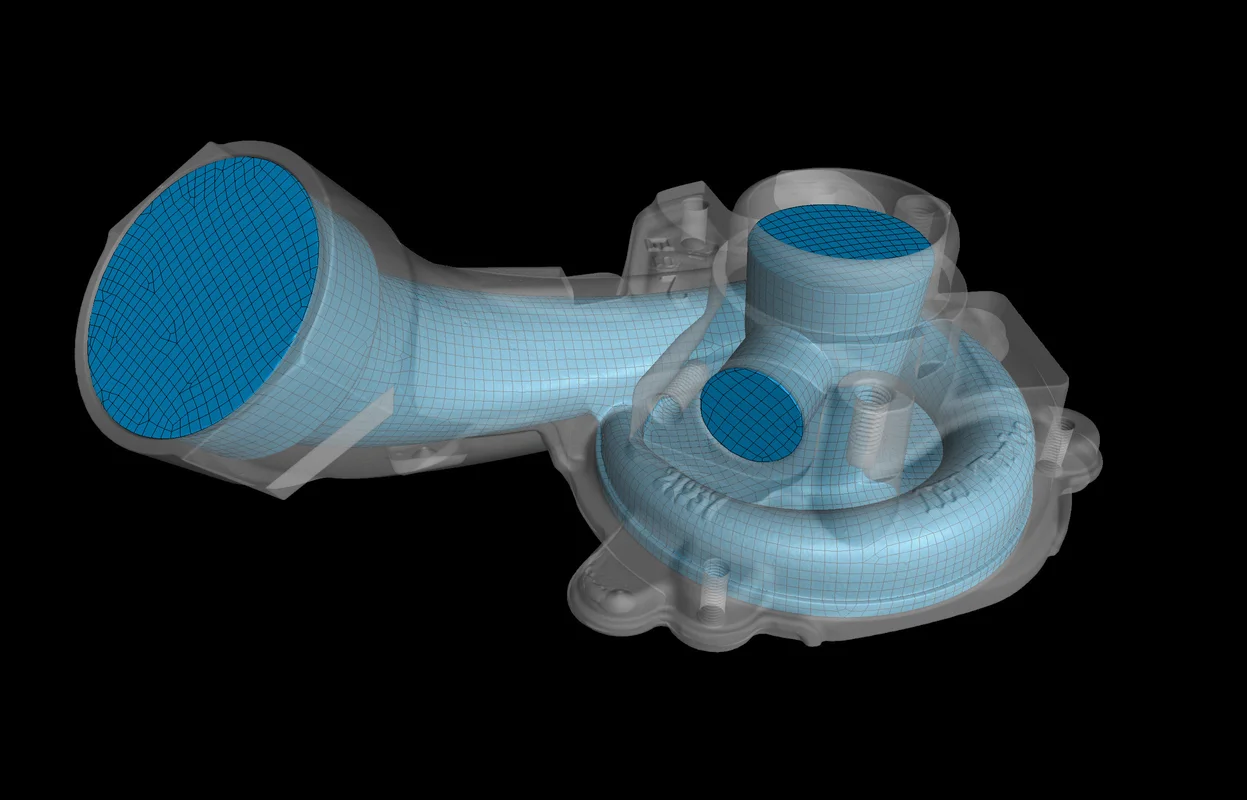
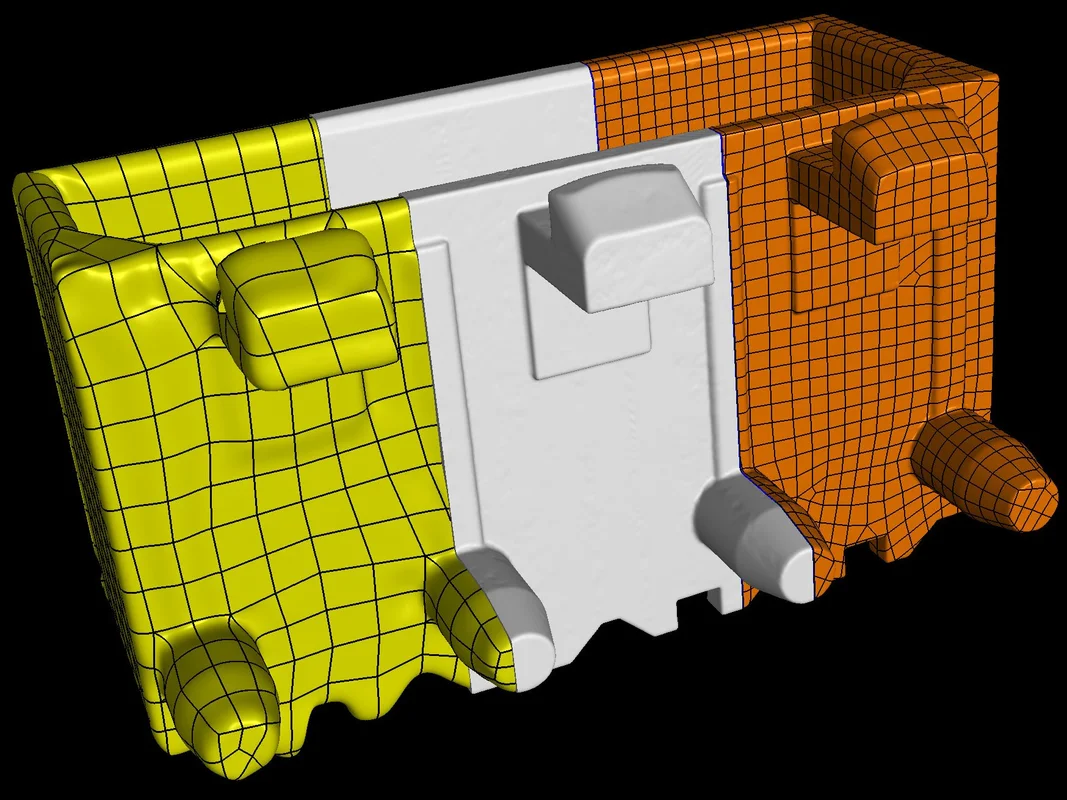
Custom Parameters for Scan to CAD Conversion in Reverse Engineering (New in 3.4.3)
For situations where the "Low," "Medium," and "High" presets in the "Convert to CAD" dialog do not fit your needs, allow us to introduce "Manual" mode with adjustable CAD conversion parameters. By giving you the option to manually adjust quad size and number of control points, we are allowing you to convert a volume or an ROI into an optimal CAD file in terms of size, quality, and level of detail.
Reverse Engineering
With its auto surface function, the new Reverse Engineering Module makes it easy to convert CT scans into CAD models that you can use in your CAD systems.
You can use these CAD models for products that don’t have existing 3D representation—cost-effectively and directly from CT or mesh data—to make manually generated design models available digitally, generate CAD models for old parts where no CAD information (or only 2D drawings) is available, update models in which the actual part or tool looks different than its master CAD model, and enable CAM systems to mill on CAD instead of meshes. All in one software, and without the need for a CAD designer or reverse engineering specialist.
The Reverse Engineering Module creates a pattern of 4-sided patches that follows the edges and main features of the model. By including these character lines, the result is a useful patch layout of untrimmed NURBS surfaces—commonly known as an auto surface model—which can be exported as a STEP file to any CAD system.
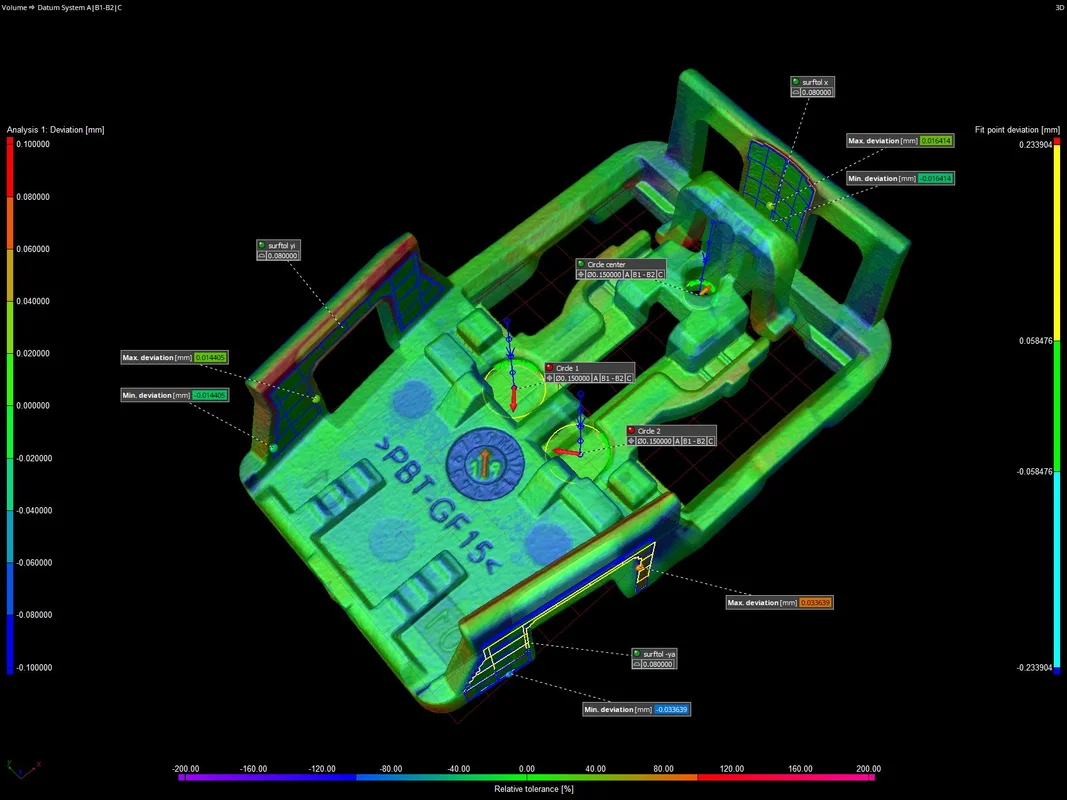
New Visualization Option for Deviations of Geometric Tolerances
A new visualization option gives answers to questions such as: Where exactly are the highest deviations located? How are the deviations distributed on a surface? Which areas of the surface were actually evaluated? Where do the pattern deviations come from? This option is helpful when a pure OK/NOK decision is not sufficient and additional information is required for various reasons (e.g., to adjust manufacturing processes or to decide if a deviation is critical).
Depending on the toleranced element, certain methods for visualizing the actual deviations can be activated, e.g., a colored and scaled deviation vector for position tolerances, while simultaneously visualizing entire patterns of position tolerances. Combined with the possibilities of bookmarks, this allows for a visual, comprehensible, and easily understandable communication of a part’s geometrical deviations.
New Tool Dock
The new, more intuitive Tool Dock reduces the mouse travel needed to navigate to the next tool. It now has fewer—but more intuitive—icons. Tools can be expanded and collapsed or pinned; by only expanding the currently used tool and automatically collapsing the others, you will eliminate the need for vertical scrolling. Tools that you want to have permanently visible (e.g., the Scene Tree) can be pinned. For the best visibility, expanded tools will always use all the available vertical screen space.
Support of 4K Displays
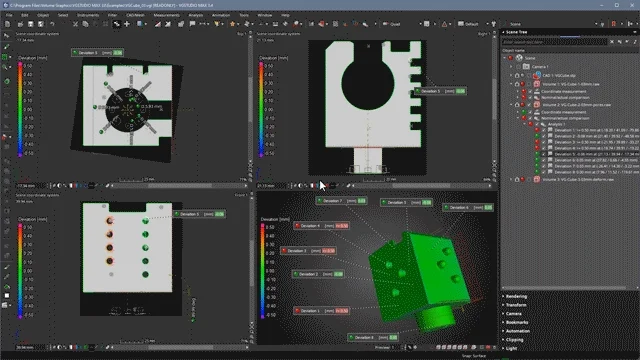
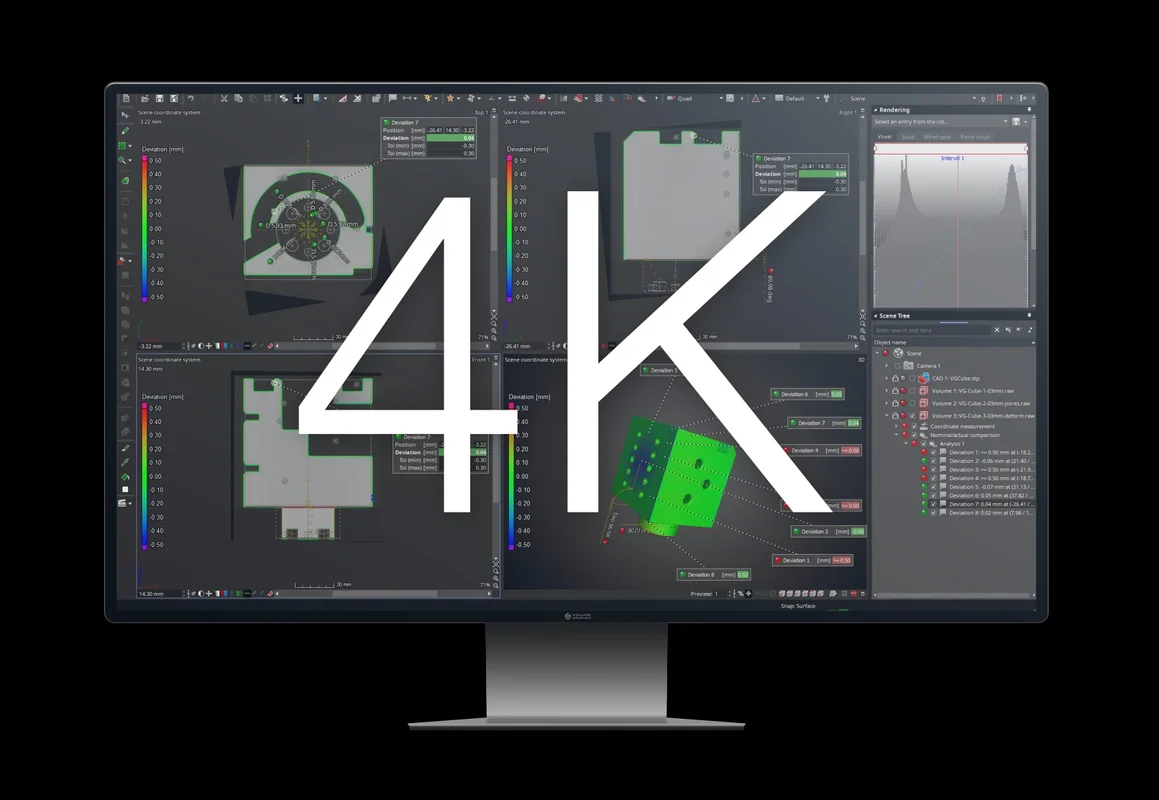
In the latest version of Volume Graphics software, the graphical user interface of all applications appears crisp and sharp, even on 4K displays. It also respects the customized scaling factor of the operating system.
Operating System Notifications
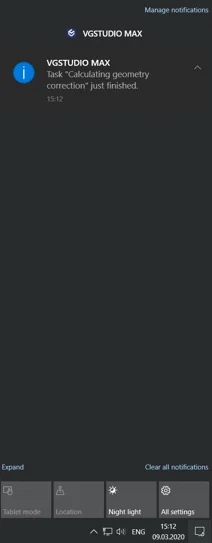
When running other applications parallel to Volume Graphics software, you will now receive a notification when calculations or other processes in the Volume Graphics applications are finished. This allows you to work simultaneously on other tasks without missing important developments in Volume Graphics applications.
Preview in Coordinate System Editor
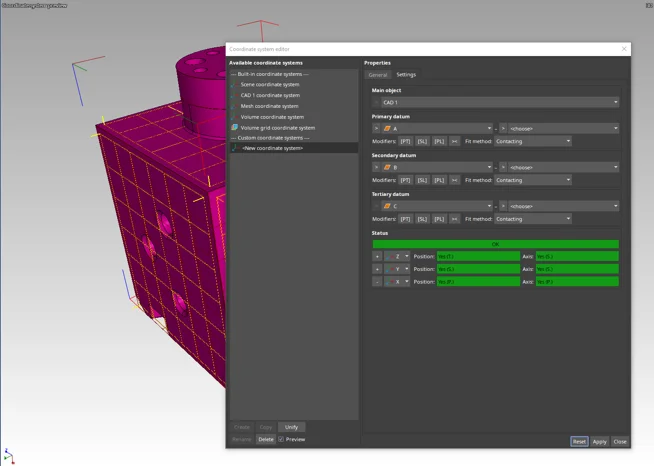
A new preview option in the coordinate system editor allows you to interactively see changes in the views while you create or modify a system. For example, with the preview option, it is no longer difficult to select the correct axis labels and orientations when creating a new coordinate system (e.g., 3-2-1 or datum system).
Helix Pattern in Coordinate Measurement Templates
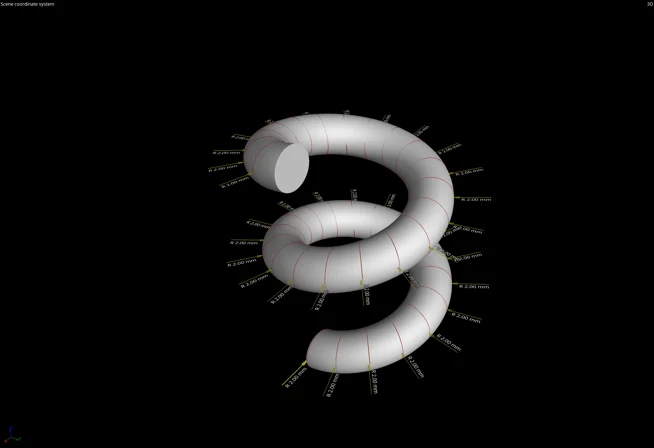
Coordinate Measurement Templates now support helix patterns, which allow you to more quickly measure parts with re-occurring geometries along a helical path (e.g., threads and gears).

Quick Play for Macros
You can now save time by quickly triggering freely configurable macros that contain arbitrary functions via predefined shortcuts, including the handling of file outputs. Quick play for macros allows you to easily automate and execute repeating steps in an otherwise manual workflow.
File I/O
- We've improved import performance when loading image stacks from a local hard disk and eliminated the need to manually alter the number of CPU threads for image stack import. (New in 3.4.3)
- Import multiple CAD models, meshes, or .vgl volumes from one storage location in one go: Just open the "Quick import" dialog from the "File" menu, the icon bar, or via "Ctrl + I" and import one or multiple objects at once. (New in 3.4.3)
- The quick file integrity check function protects your .vgl projects from loading incorrect reference volume data. It offers an equal level of security compared to the full check while reducing the demand on hardware resources, like CPU usage and network traffic.
Visualization and Navigation
- Faster creation and replacement of bookmarks, resulting in performance that is nearly 10x faster in complex projects that have, for example, a large number of coordinate measurement objects.
- Preference options for changing the appearance of the indicator in all views, allowing you to adjust size and shape (e.g., circle) of the indicator and thereby ensuring that the indicator itself is not covering what you actually want to show.
- Import and export of an application layout to store an existing icon bar and tool dock configuration for re-use on a different computer or sharing with colleagues. This allows for easier standardization of application layouts for different workflows, across computers and company sites.
Geometry Elements
- Improved refitting and accuracy for profile tolerances: When profile tolerances need to be evaluated on complex shapes, it may be difficult to specify a measurement template that can be applied to several different objects. But now, freeform surfaces created on CAD faces are watertight on common edges and can be refitted more reliably due to the ability to specify a number of iterations for the refitting process, which also improves the accuracy of profile tolerances.
- You can automatically adjust the size of geometry elements on the actual object: Until now, geometry elements have kept their original size (from the time they were created), even when they are applied to a different object, which requires the user to manually trigger a size adjustment (e.g., to the resulting fit points). Now, the user has the option to automatically refit the size on the actual object for fitted geometry elements. Combined elements (e.g., symmetry) will always adjust their size immediately according to their source elements.
- Option to change the storage system for several geometry elements at once: In earlier versions, the adjustment of the storage system of a geometry element could only be done by editing each individual element, making it time-consuming to adjust measurement plans. Now, an additional column on the geometry element tab of the CM report shows the storage systems of all geometry elements and allows you to select several geometry elements at once and change their storage system.
Coordinate Systems
- User-defined axes in datum systems: You can now specify the axes labels and orientations during the creation of a datum system in the coordinate system editor, allowing you to create a datum alignment where the views mirror those in your drawing or CAD system.
Alignment
- Align objects by local coordinate systems: You can now easily align two different objects (e.g., the nominal CAD model and the actual volume) relative to each other according to a certain alignment method, e.g., 3-2-1 or datum, by simply selecting both local coordinate systems and using the "Apply transformation" function without needing to change the alignment of the nominal object.
Dimensional Metrology
- Apply a default column layout in tables directly from the context menu: Most tables in the application now allow you to store and apply a certain column layout, making it easy to unify the order and layout of the table columns across different projects. (New in 3.4.3)
- Improved handling for the creation of features and geometry elements: You now have more options (e.g., to clear the fit points) in the context menus of the 2D and 3D views when creating geometry elements and features. This makes it more efficient to create measurement templates, since interactions with dialogs can be reduced or completely omitted.
Nominal/Actual Comparison
- ROI from a nominal/actual comparison: Creating an ROI from nominal/actual comparison components makes them directly available for further use in practically everything that works on ROIs, e.g., alignments, object conversions, analysis, or component geometry corrections. This way, the surface areas with a certain deviation range (components) immediately become available for further processing, e.g., to apply dedicated render settings, exclude or include the areas from further analysis, or surface extractions. These workflows can also be completely automated.
Macros
- Saving of last-used automation elements: Because the application now remembers a set of macros and automatically makes it available after startup, you no longer need to manually prepare the application after each startup in scenarios where the same workflow is used repeatedly for a longer period of time.
Reporting and Traceability
- The new reporting function offers a new display of the data source names of tables and lists in report sections while in edit mode. This allows you to see the data source (e.g., defect table) that is being used by layout elements and which elements share a common data source. (New in 3.4.5)
- "Save image(s)" stores last-used settings: When manually inspecting a part and creating a series of images, "Save image(s)" now remembers the last settings that were used, such as resolution or picture-in-picture mode. This makes your inspection process faster and smoother, especially in combination with the new shortcut for the quick play of macros.
Volume Graphics GmbH
Speyerer Straße 4-6
69115 Heidelberg
Germany
Phone: +49 6221 73920 60
Fax: +49 6221 73920 88
Sales enquiries:
sales@volumegraphics.com
Modifications and errors reserved.


