This page is not compatible with Internet Explorer.
For security reasons, we recommend that you use an up-to-date browser, such as Microsoft Edge, Google Chrome, Safari, or Mozilla Firefox.
What's New in VGSTUDIO
Discover the Exciting New Capabilities of Version 3.3 (as of December 2019, Version 3.3.3)
Data Quality Analysis
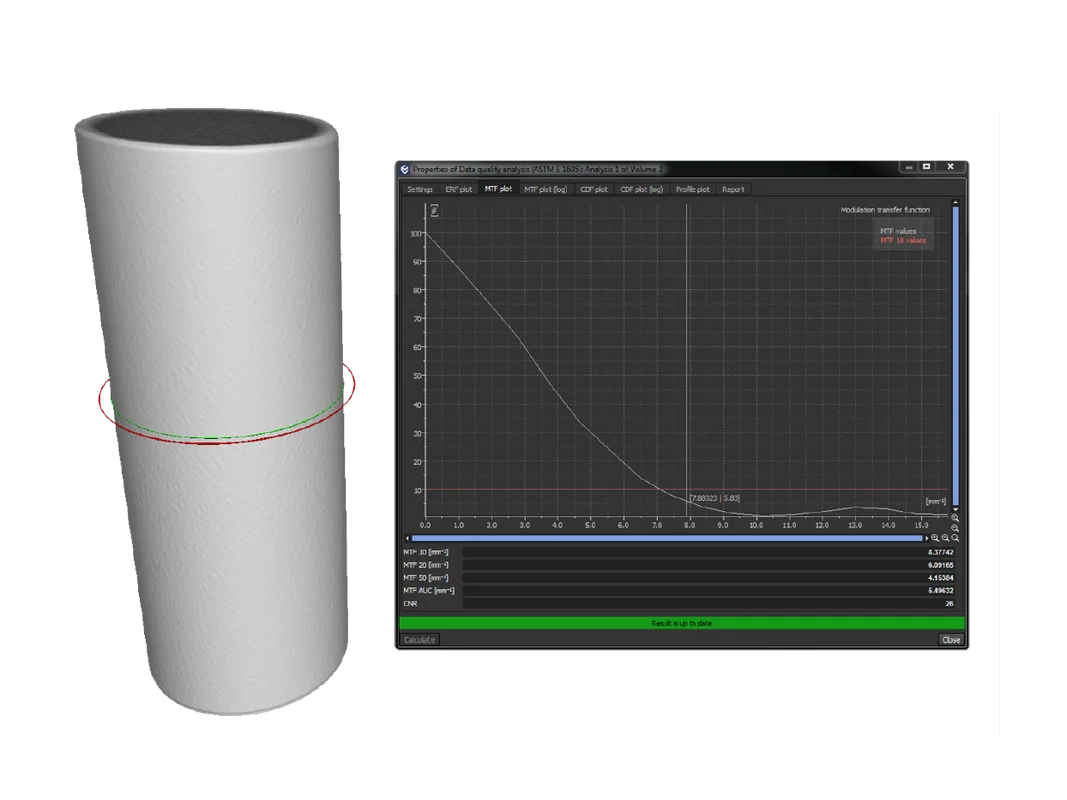
Monitor the data quality of your CT scans over time directly in VGSTUDIO—based on the determination of the Modulation Transfer Function (MTF) and the Contrast Discrimination Function (CDF) from a scan of a cylindrical rod according to the ASTM Standard E 1695 “Standard Test Method for Measurement of Computed Tomography (CT) System Performance”. The data quality analysis enables long-term monitoring of the CT scan quality in the same software you use for your measurements and defect analyses. It can now also extract 2D slices from a 3D data set.
The determination is based on examination of the CT image of a uniform disk of material. The MTF is a measure for the sharpness of the edge while the CDF is related to the contrast-to-noise ratio. These functions are key determinants of the structural resolution of the CT system. The variation of the data quality along the axis of the scanned cylindrical rod can be examined by varying the position of the circular cross section for which MTF and CDF are determined.


Reportable Bookmarks
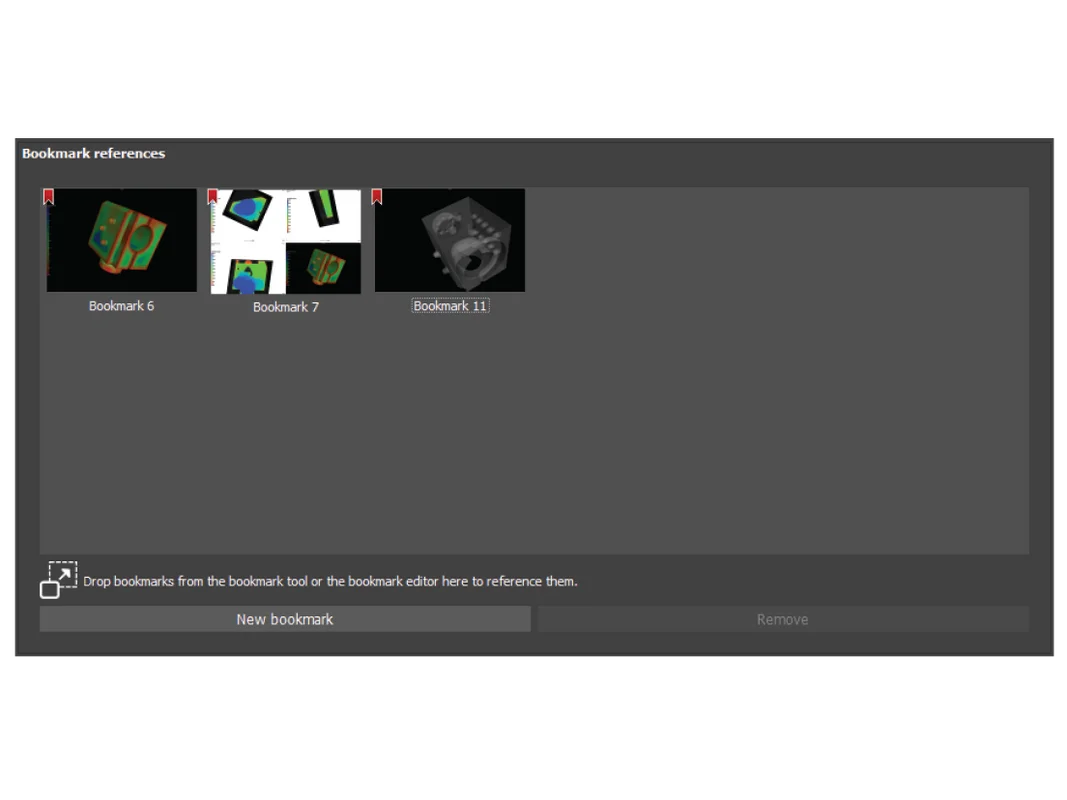
Reportable bookmarks make creating reports of top-level objects and analyses more flexible and highly reproducible. Bookmarks can now be referenced by volumes and other top-level objects, analyses, and measurement plans and are included in the .vgrf format as well as in the associated reports in Microsoft Excel (requires Microsoft Excel) and reports in the .pdf format. Reportable bookmarks offer a combination of high flexibility—because arbitrary 2D and 3D views can be stored as bookmarks—and high reproducibility for manual inspections—because bookmarks can be stored as templates which can be re-used in subsequent projects.
Adaptive Opacity and Color Mapping for 2D Views
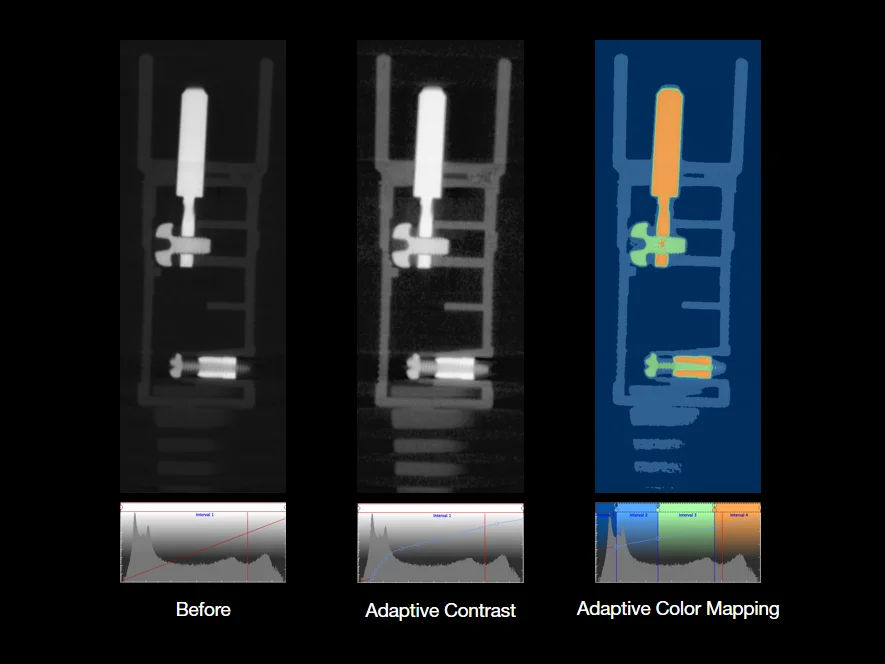
Automatically adjust the gray value contrast for an optimal visual appearance of all details in the data set. Especially in data sets with a high density range (e.g., multi-material scans), relevant information can be hard to perceive using the default linear gray value mapping. An adaptive preset in the Rendering tool automatically generates an opacity curve which allows optimal perception based on the current gray value histogram. Similar adaptive presets provide an automatic segmentation of the gray value range with up to five colors.

Refined User Interface
A new, more streamlined user interface in all applications is the most obvious change in version 3.3. A better visibility of symbols and texts makes any task in the software even more straightforward.
Performance Enhancements
When using version 3.3, you will immediately realize how much more responsive the application feels and how much faster some processes are. The performance enhancements affect everyday tasks such as the opening of very large .vgl files, importing projection images, rendering and navigation in 2D and 3D views, copy & paste actions in the Scene Tree, and autosaving.
File I/O
- You can now use the shortcut "Ctrl + Shift + G" to save relevant view content as an image while manually inspecting a part. This saves time and reduces interruptions in your inspection workflow. (new in 3.3.3)
- Faster saving of large .vgl files—in addition to faster loading already introduced with version 3.3.0. This saves time when handling large .vgl files (e.g., when a project contains large measurement templates with a large number of geometry elements and features, especially freeform tolerances, or complex analyses with a large number of results). (new 3.3.1)
- Faster autosave, resulting in about 10 times faster automatic file saving for large .vgl files.
- Import mesh files by simply dragging and dropping the file into the scene.
Reconstruction
- New projection importer for shorter reconstruction times and a more responsive application during import.
All Analyses
- Columns of an analysis table can now be hidden or shown with one click, giving you an easy and convenient way to display only the information of interest and reduce the amount of reported data in the standard reporting (HTML, PDF). (new in 3.3.3)
Reporting and Traceability
- The object meta information now includes the fields production time and cavity number, improving traceability and filtering options, e.g., in reports.
- You can now display meta information in text overlays in 2D and 3D windows, both the built-in meta information fields and custom fields from the component, the scan, or the scanner manufacturer section. This increases the traceability of screenshots and, when viewing several similar scans in one scene, better indicates which scan is currently displayed and analyzed.
Visualization and Navigation
- Cylindrical and conical clipping objects allow for faster visualization of rotationally symmetric objects, such as axles, batteries, or pipings. (new in 3.3.1)
- Improved performance of rendering and navigation in 2D and 3D views for a more fluent and immediate response, e.g., when zooming, slice scrolling, rotating, or moving an object.
- Improved interactiveness and responsiveness upon selections or copy & paste actions in the Scene Tree, creation of annotations, and selections in tables when working with projects with many objects in the Scene Tree.
Volume Graphics GmbH
Speyerer Straße 4-6
69115 Heidelberg
Germany
Phone: +49 6221 73920 60
Fax: +49 6221 73920 88
Sales enquiries:
sales@volumegraphics.com
Modifications and errors reserved.
