This page is not compatible with Internet Explorer.
For security reasons, we recommend that you use an up-to-date browser, such as Microsoft Edge, Google Chrome, Safari, or Mozilla Firefox.
What's New in VGSTUDIO
Discover the Exciting New Capabilities of Version 3.4 (as of February 2021, Version 3.4.5)
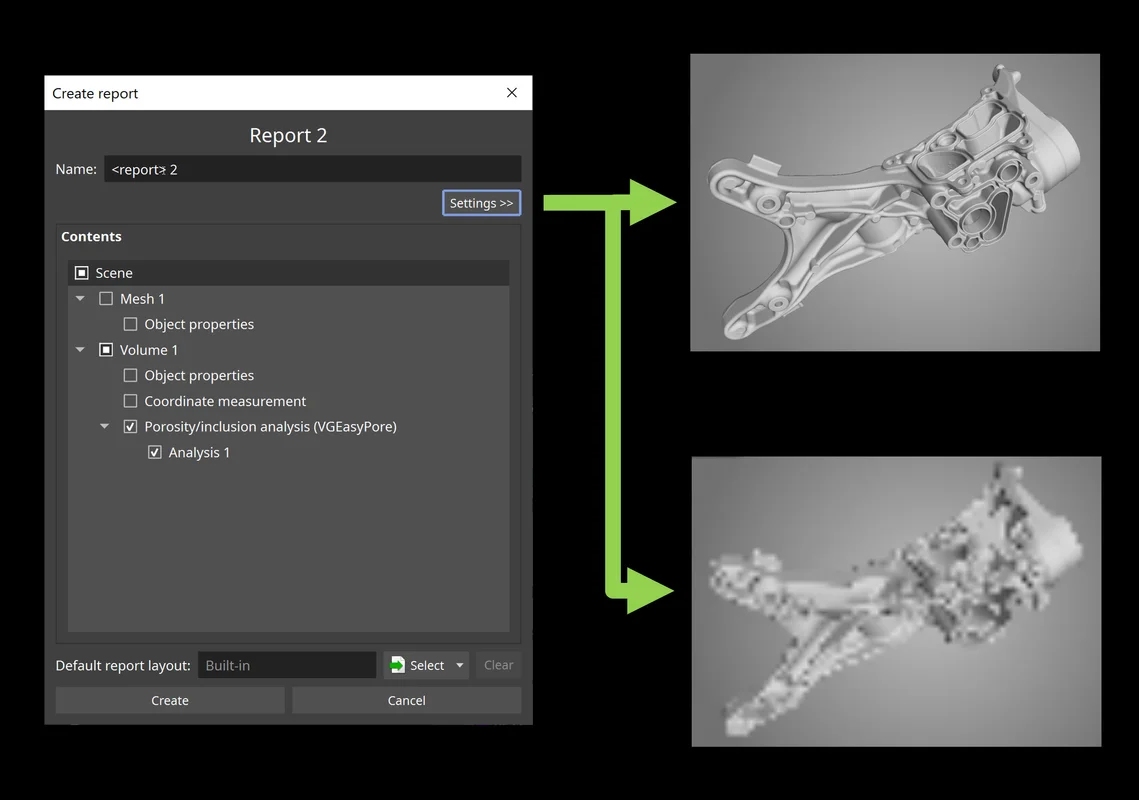
Image Generation Settings in New Reporting (New in 3.4.5)
Custom image generation settings, such as for resolution and opacity mapping, are now also available for the new integrated reporting function and can be specified for individual objects or for the entire report. This way, image creation is consistent even in automation scenarios and reporting the same content using different settings is easily possible.
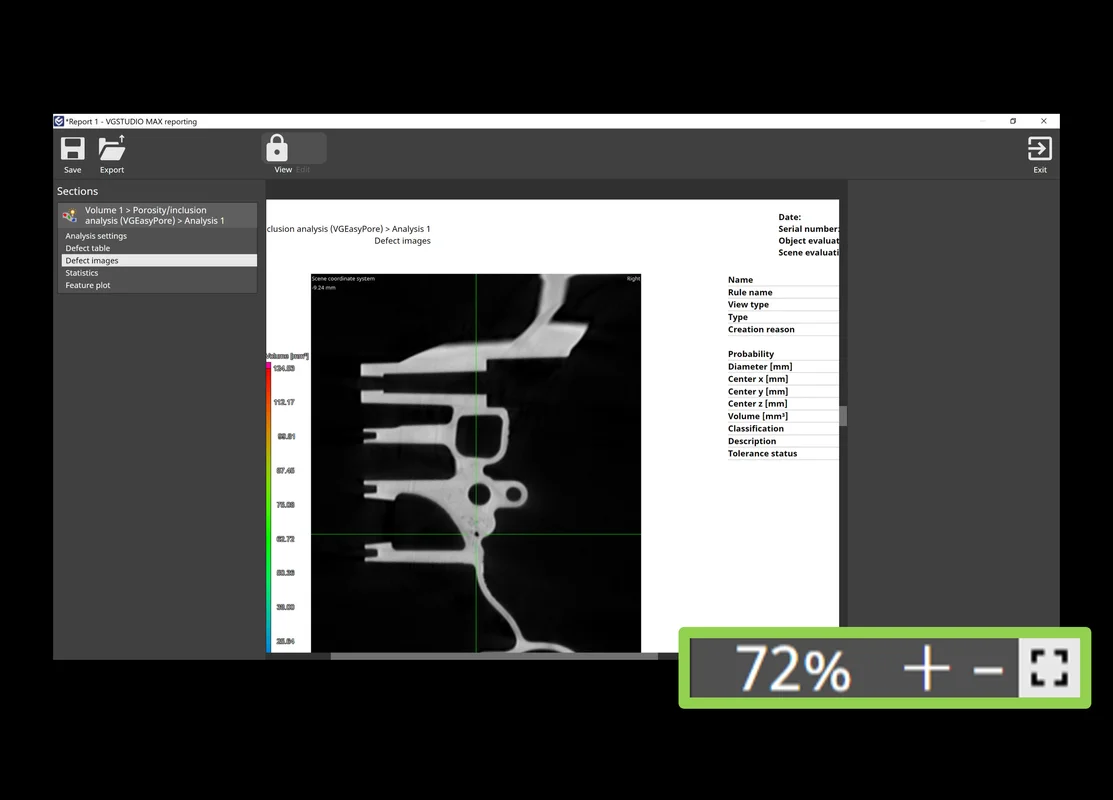
Zoom Function in Report Editor (New in 3.4.5)
The new zoom function in the WYSIWYG (What You See Is What You Get) editor lets you easily fit relevant content to your screen while viewing or editing a report. It automatically scales the report pages to fit the available space or allows you to set a manual zoom level depending on the level of detail you want to see.
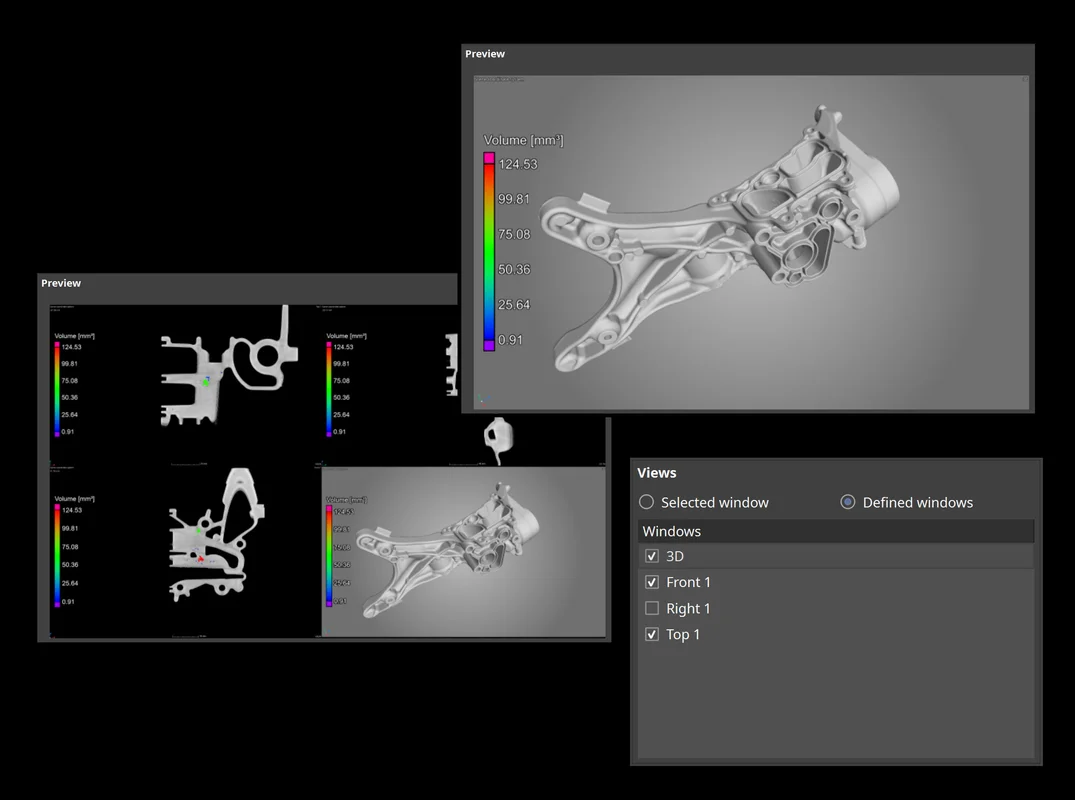
Window Options when Saving Images (New in 3.4.5)
A new save image option allows you to save either the currently selected workspace window or a manually defined combination of workspace windows. Depending on your manual inspection workflow, one or the other might be more convenient for you—the new option in the dialog allows for both while keeping the shortcut and automatic storage of other image settings unchanged.
New Integrated Reporting (New in 3.4.4)
Completely new integrated reporting now lets you edit and view reports in Volume Graphics applications exactly as they will appear in the PDF, customize them, automate their creation, and store them directly in your .vgl project. The new integrated reporting function is a fast way to create presentable .pdf reports without having to switch to external software like Microsoft Excel and is available throughout our products, even in our free viewer applications myVGL and VGMETROLOGY VIEWER. And because report creation and export are macro-recordable, the new reporting is also available for automation and VGinLINE.
WYSIWYG Report Editor (New in 3.4.4)
The new WYSIWYG (What You See Is What You Get) editor as part of the completely new integrated reporting function makes it easy to create a more digestible view of your project data. You can create reports that contain all or a subset of the reportable content in the scene and customize the displayable content, such as images, table columns, or page layouts. Additionally, data sections in the report, like selected metainformation, volume information, analysis settings, or result images, can be reordered or removed altogether. Once a custom layout has been created, it can be stored and reused when similar content is to be reported.
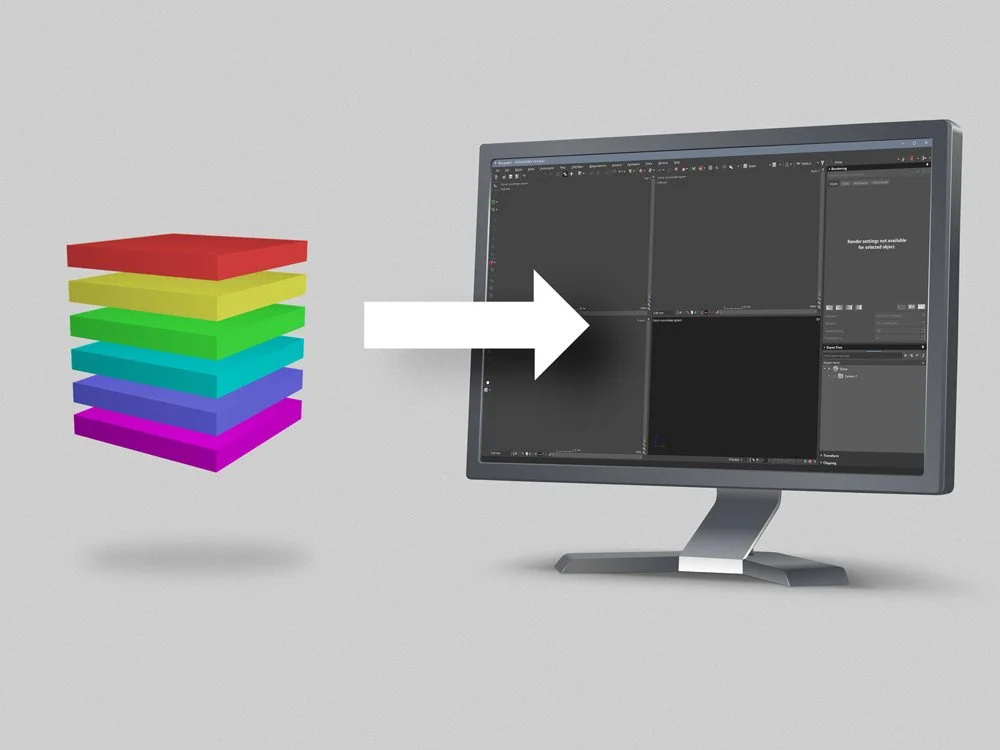
HiXCT Multiple Volume Import (New in 3.4.3)
You can now load volume data from Hitachi Industrial CT systems. The HiXCT file format, which is typical for Hitachi Industrial CT systems, optionally supports the import of volumes coming from a multi-circle scan.
Faster Access to Visualization Options (New in 3.4.3)
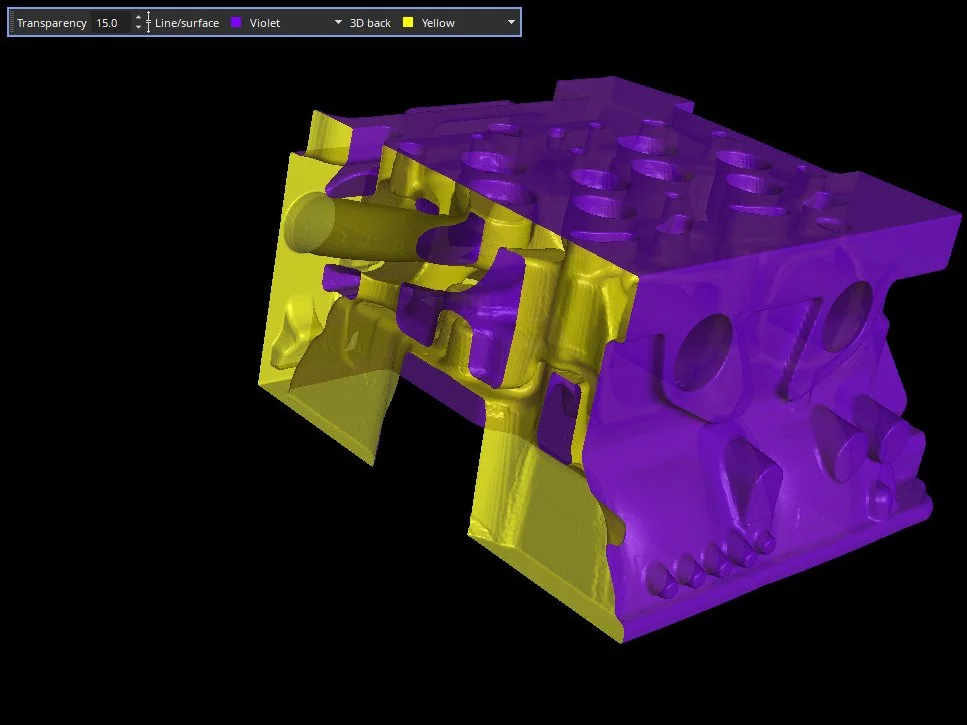
Change transparency and colors of volumes, CAD objects, and meshes faster by accessing the most frequently used visualization options in one compact icon bar.
Exact Angle Reconstruction for Circular Trajectories
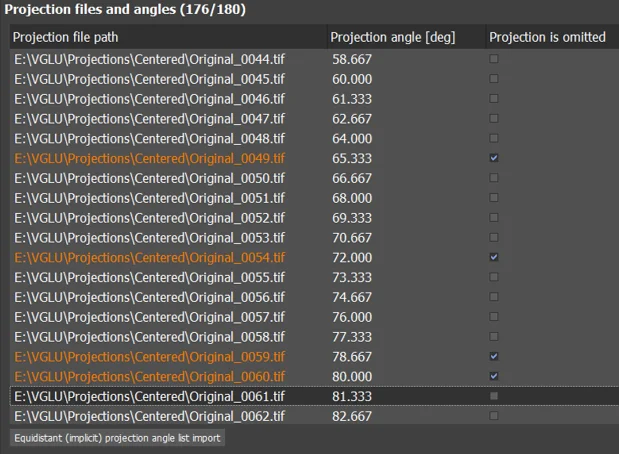
You can now factor in the real angular position of each projection for a high-quality reconstruction. If your CT system is equipped with an angular encoder that provides the actual angular position of each projection, you can now use this information to increase the spatial resolution of your scan—or if some projections went missing during your CT scan, you can now skip these projections and still get a high-quality reconstruction without artifacts from missing or incomplete projections and without having to perform re-scans.
Auto-Adjusting Opacity Curve
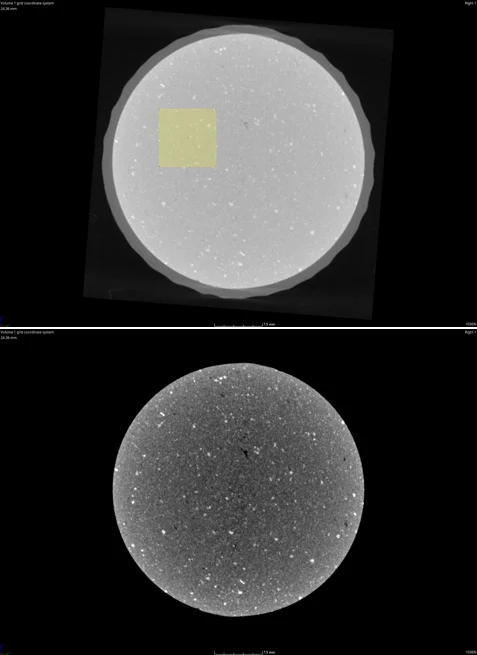
You can now save time by using the new, automatically adjusting opacity curve. Based on a rectangle drawn in a 2D view of one object, the contrast for the selected region will automatically be optimized. With one click, the contrast can be converted to an opacity curve that provides the optimal contrast for the selected region. You can also apply this to several objects in the scene to compare the selected region between two or more scans.
This is helpful for the visual inspection of an area of interest or the same area of interest for two or more objects.
New Tool Dock
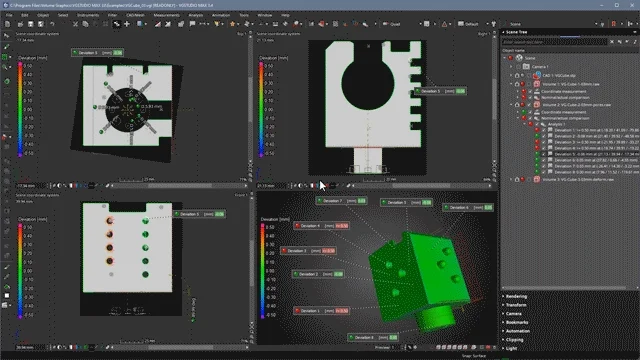
The new, more intuitive Tool Dock reduces the mouse travel needed to navigate to the next tool. It now has fewer—but more intuitive—icons. Tools can be expanded and collapsed or pinned; by only expanding the currently used tool and automatically collapsing the others, you will eliminate the need for vertical scrolling. Tools that you want to have permanently visible (e.g., the Scene Tree) can be pinned. For the best visibility, expanded tools will always use all the available vertical screen space.
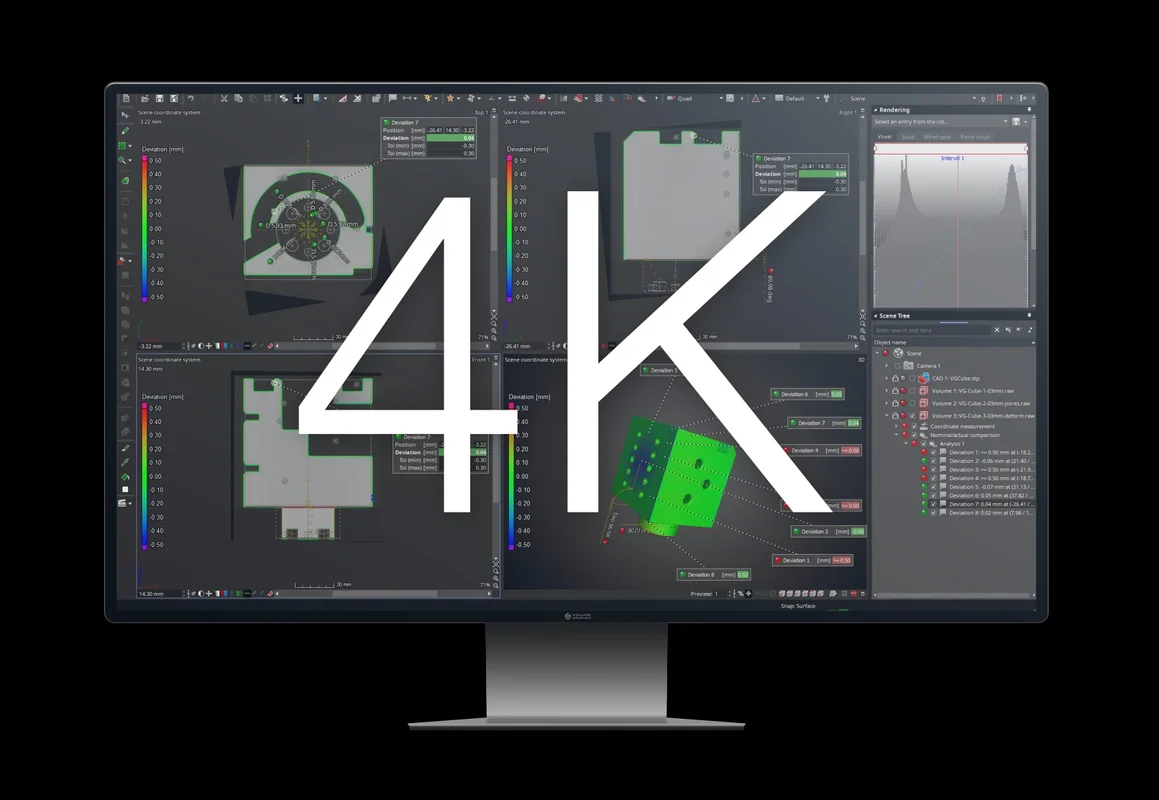
Support of 4K Displays
In the latest version of Volume Graphics software, the graphical user interface of all applications appears crisp and sharp, even on 4K displays. It also respects the customized scaling factor of the operating system.
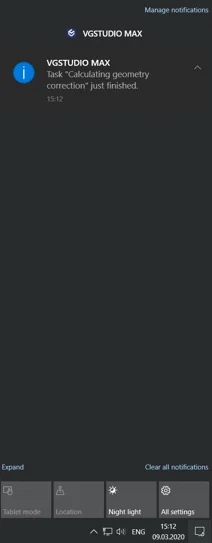
Operating System Notifications
When running other applications parallel to Volume Graphics software, you will now receive a notification when calculations or other processes in the Volume Graphics applications are finished. This allows you to work simultaneously on other tasks without missing important developments in Volume Graphics applications.
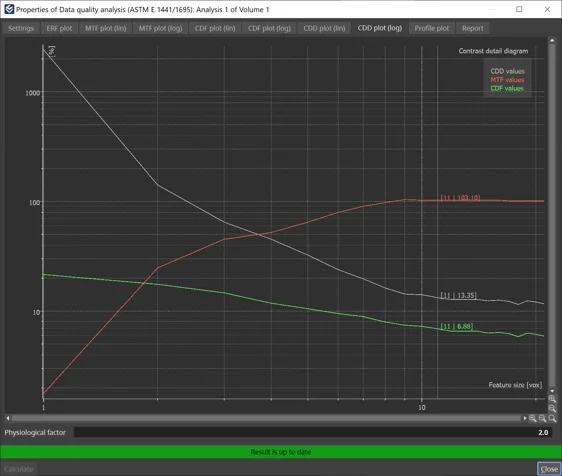
Contrast Detail Diagram According to ASTM E 1441
You can now monitor the state of your CT system over time by calculating the Contrast Detail Diagram (CDD), which combines structural and contrast resolution in one measurement according to ASTM E 1441. This parameter estimates the minimum contrast that a feature of a given size must have in order to be detectable. The new measure is supported in addition to the MTF (Modulation Transfer Function) and CDF (Contrast Discrimination Function).
File I/O
- We've improved import performance when loading image stacks from a local hard disk and eliminated the need to manually alter the number of CPU threads for image stack import. (New in 3.4.3)
- Import multiple CAD models, meshes, or .vgl volumes from one storage location in one go: Just open the "Quick import" dialog from the "File" menu, the icon bar, or via "Ctrl + I" and import one or multiple objects at once. (New in 3.4.3)
- Improved support for new NSI file format (.nsihdr): If the necessary converter application is missing, you will now get an informative error message. Also, the "Pack and go" function now works as expected with the new format. (New in 3.4.3)
- The quick file integrity check function protects your .vgl projects from loading incorrect reference volume data. It offers an equal level of security compared to the full check while reducing the demand on hardware resources, like CPU usage and network traffic.
Visualization and Navigation
- Faster creation and replacement of bookmarks, resulting in performance that is nearly 10x faster in complex projects that have, for example, a large number of coordinate measurement objects.
- Preference options for changing the appearance of the indicator in all views, allowing you to adjust size and shape (e.g., circle) of the indicator and thereby ensuring that the indicator itself is not covering what you actually want to show.
- Import and export of an application layout to store an existing icon bar and tool dock configuration for re-use on a different computer or sharing with colleagues. This allows for easier standardization of application layouts for different workflows, across computers and company sites.
Coordinate Measurement
- Apply a default column layout in tables directly from the context menu: Most tables in the application now allow you to store and apply a certain column layout, making it easy to unify the order and layout of the table columns across different projects. (New in 3.4.3)
Reporting and Traceability
- The new reporting function offers a new display of the data source names of tables and lists in report sections while in edit mode. This allows you to see the data source (e.g., defect table) that is being used by layout elements and which elements share a common data source. (New in 3.4.5)
- "Save image(s)" stores last-used settings: When manually inspecting a part and creating a series of images, "Save image(s)" now remembers the last settings that were used, such as resolution or picture-in-picture mode. This makes your inspection process faster and smoother, especially in combination with the new shortcut for the quick play of macros.
Volume Graphics GmbH
Speyerer Straße 4-6
69115 Heidelberg
Germany
Phone: +49 6221 73920 60
Fax: +49 6221 73920 88
Sales enquiries:
sales@volumegraphics.com
Modifications and errors reserved.

