This page is not compatible with Internet Explorer.
For security reasons, we recommend that you use an up-to-date browser, such as Microsoft Edge, Google Chrome, Safari, or Mozilla Firefox.
What's New in VGinLINE
Discover the Exciting New Capabilities of Version 3.5 (as of December 2021, Version 3.5.2)
Version 3.5.2 of VGinLINE is now available. Building on the innovations of version 3.4.x, you will benefit from the following new capabilities* in version 3.5.2:
Reporting and Traceability
New Integrated Reporting
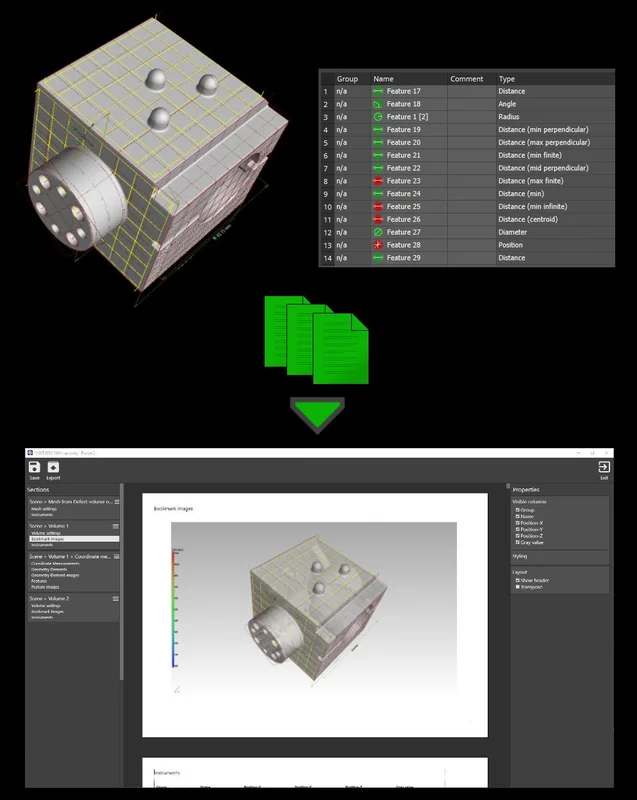
Edit and view reports in Volume Graphics applications exactly as they would appear in the PDF. The completely new integrated reporting function introduced in version 3.4.4 lets you customize reports, automate their creation, and store them directly in your .vgl project:
- The new integrated reporting function is a fast way to create presentable .pdf reports without having to switch to external software, such as Microsoft Excel, and is available across our products, even in our free viewer applications myVGL and VGMETROLOGY VIEWER. And because creating and exporting reports are macro-recordable, the new reporting function is also available for automation and VGinLINE.
- The new WYSIWYG (What You See Is What You Get) editor makes it easy to create a more digestible view of your project data. You can create reports that contain all or a subset of the reportable content in the scene and customize the displayable content, such as images, table columns, and page layouts. Additionally, data sections in the report, like selected metainformation, volume information, analysis settings, and result images, can be reordered or removed altogether. Once a custom layout has been created, it can be stored and reused when similar content is to be reported.
- The new reporting function is introduced as an additional option and will be continuously enhanced in the future. Reporting via Excel will continue to be supported, while the existing integrated .html reporting with its current scope of functionality will remain available for a limited period of time.
Advanced Table Properties in Report Editor
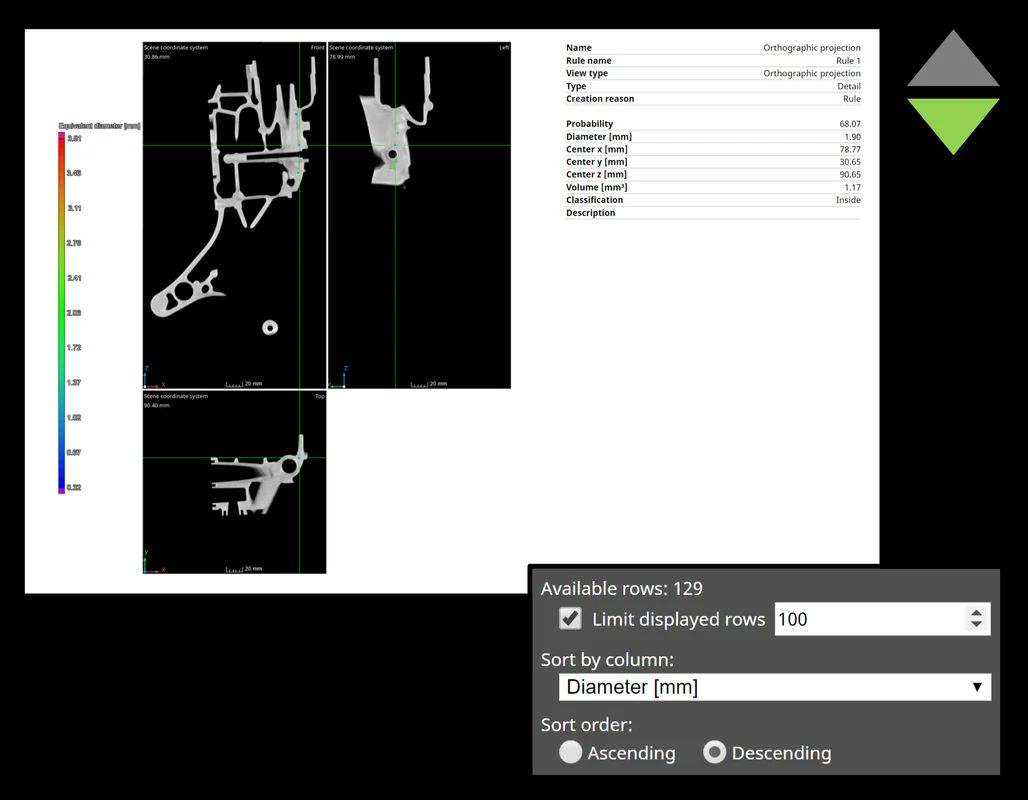
Advanced table properties in the new WYSIWYG report editor give you full control over the page count of your report and let you focus your reports on aspects that are especially relevant. While the software creates the full set of results, you can now customize the sorting of rows within tables and limit the displayed rows to display only a subset of result components (for example, defects) or control the order of images (for example, to display the largest defects first).
Ordering Page Elements in Report Editor
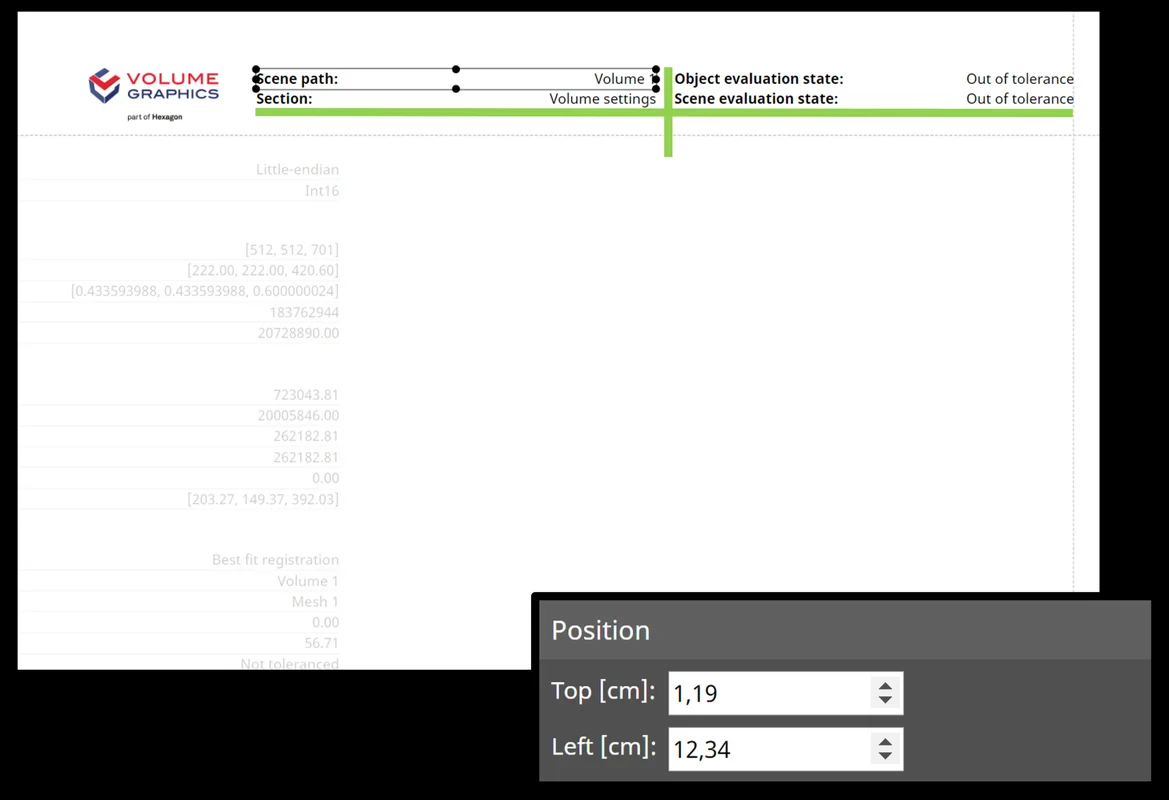
Change the order and position of elements on a page to create customized report layouts in the WYSIWYG editor. You can now determine the element positions by entering numerical values, which comes in handy when you want to align elements with each other or easily compose text content and graphical elements by controlling the order of elements via the context menu.

Customizable Report Sections and External Images
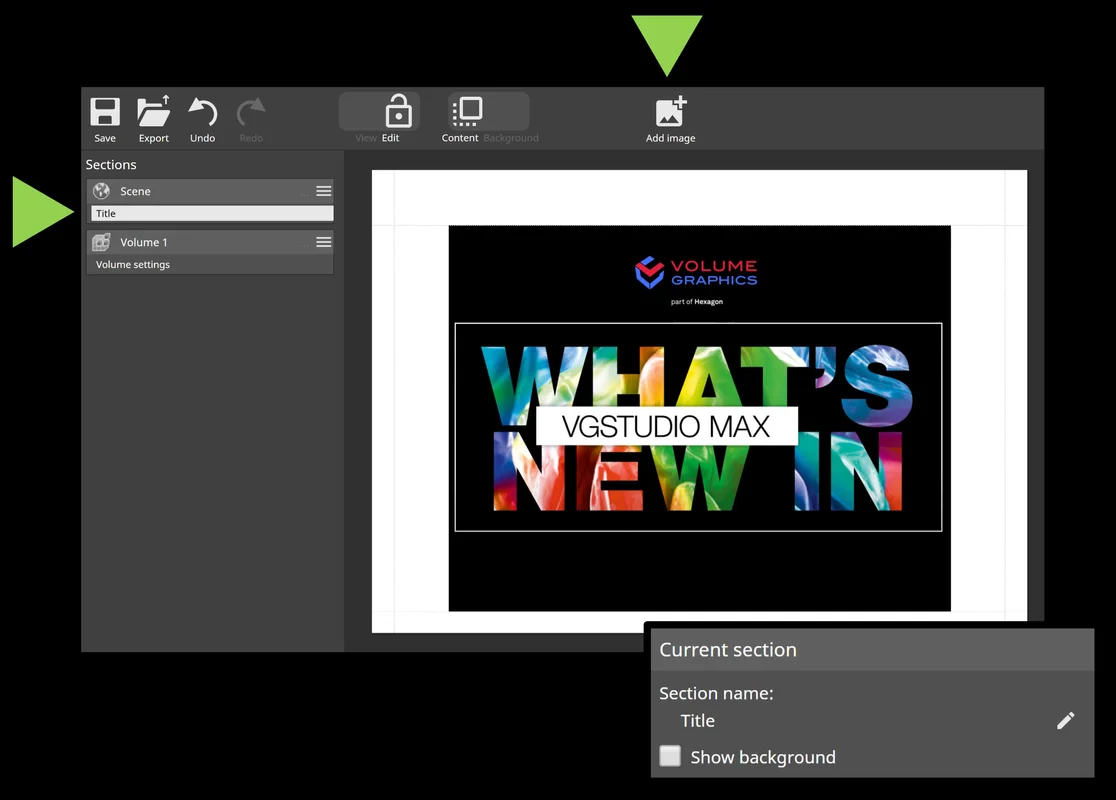
Customizable report sections and images from external sources give you even more flexibility for your report layouts. In the WYSIWYG editor, you can now add empty sections, rename sections to more accurately describe their content, and enable/disable the background for individual sections. By incorporating external images, you can mix content created in Volume Graphics software with relevant external content to create stunning visuals, such as for impressive title pages.

Q-DAS Export for Porosity/Inclusion Analysis Results
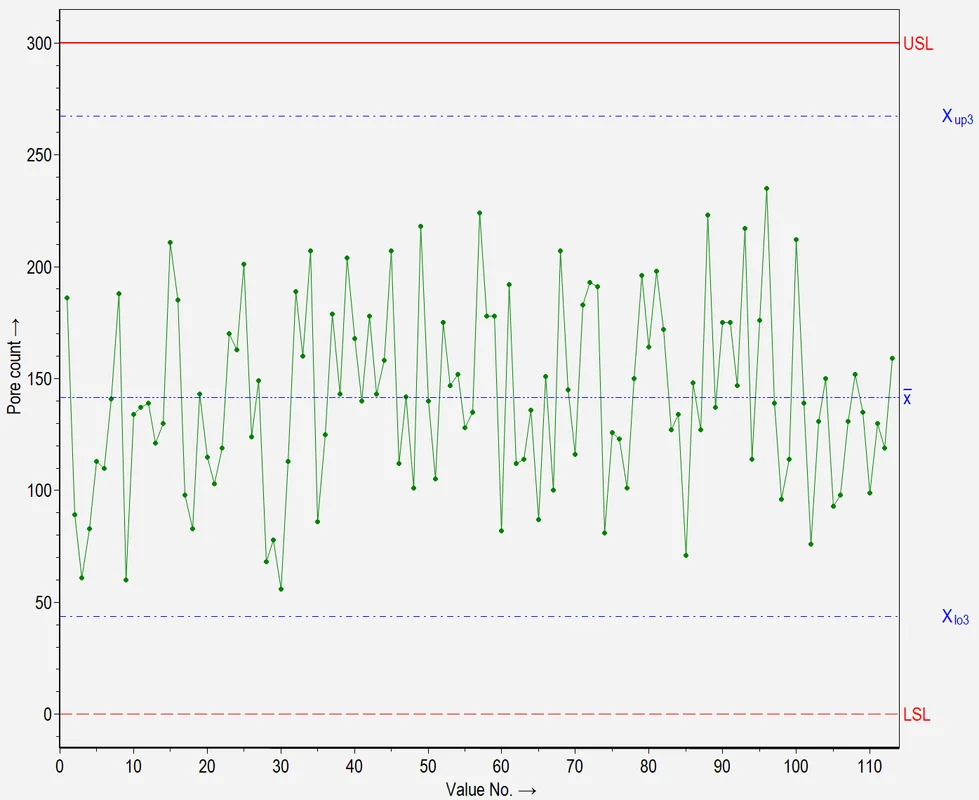
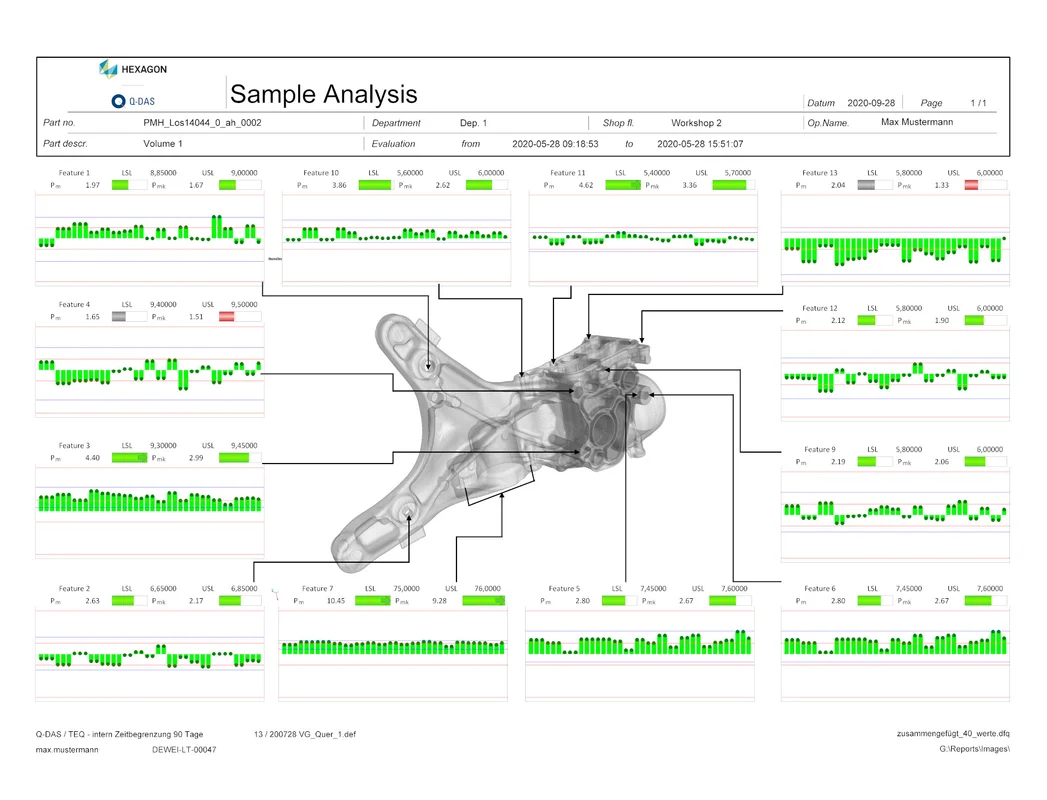
Use porosity/inclusion analysis results for process qualification or statistical analysis. Starting with version 3.4.5, you can export toleranced, global porosity/inclusion analysis results and related tolerances in the Q-DAS ASCII transfer format for use in statistics software, such as qs-STAT from Q-DAS.

Improved Q-DAS Export for More Analysis Results
Improved Q-DAS export for toleranced, global wall thickness analysis, nominal/actual comparison, and fiber composite material analysis results allows you to easily transfer these results to statistics software, such as Q-DAS qs-STAT, for process qualification or statistical analysis.

More Customizable Report Layouts
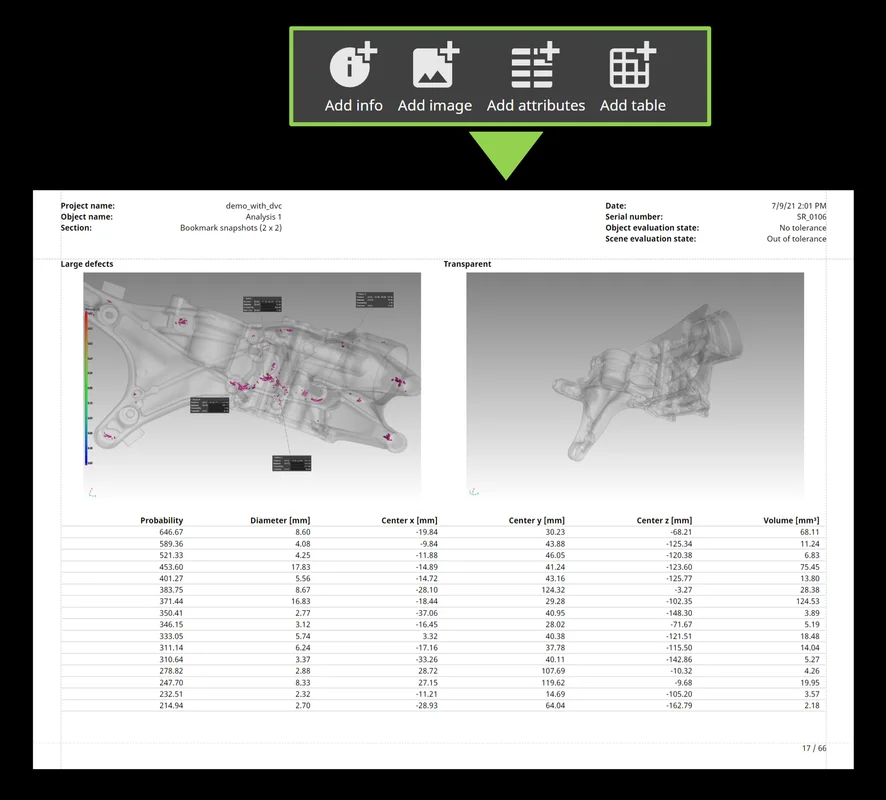
Create entirely new report page layouts by combining arbitrary information from reported objects, for example, to create overview sections or sections that contain multiple result images of a part. You can choose from images, attributes, tables, and info fields and arrange them flexibly to customize the way results, settings, images, and other information are presented on report pages.

Resizing and Re-Ordering Table Columns in Reports
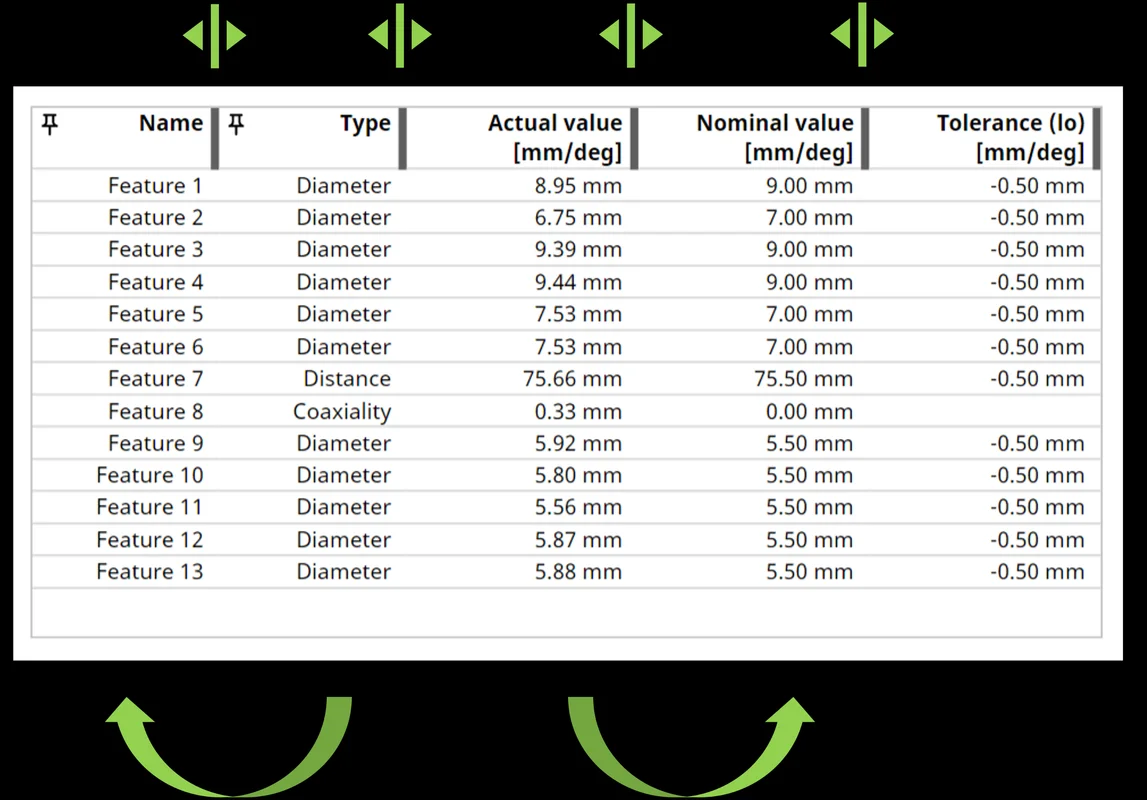
Customize the order of table columns and the size allocated to the individual columns directly in the report editor. For example, you can group important columns, move columns to the beginning of the table, and optimize the use of space on report pages by resizing columns. This feature brings customization options similar to the tables used in the original application dialogs to the new report editor.

More Info Field Options in Reports
Customize your reports by changing the format of the displayed report date/time or project file path or by displaying the name of the reported object on a page, by means of additional info field options for report background and sections. This gives you more control over the way information is displayed on report pages, regardless of system date/time settings, and, in general, more customization options.

Re-Ordering of Section Groups in the Report Editor
By changing the order in which the pages of reported objects are displayed in the report, you can now semantically group report pages, even if the reported objects are at different positions in the scene hierarchy.

More New Reporting and Traceability Features:
- Built-in sections for multiple images on a single page: You can now make reports shorter by using sections that place multiple snapshots, bookmarks, or automatically created images on a single page. These new built-in sections provide more flexibility and can also be used as an example of creating entirely customized multi-element sections.
- Support for digital volume correlation (DVC) analysis results: You can now include default sections for the results of a digital volume correlation analysis in reports created with the new report editor.

Support for Specific Report Templates
Support for Specific Report Templates
Re-create reports by using customized layouts for the content of a specific scene configuration, either automatically or manually. This allows you to easily create highly customized reports that exactly match and display the results of a specific type of inspection.

P 203 Quality Factor Support in Reports
The quality measure of the CT scan called "Q factor," proposed by the BDG Reference Sheet P 203, is now included in reports, which gives you a more complete picture of all parameters related to a P 203 analysis.

VGinLINE APPROVER
Multi-User Support for VGinLINE APPROVER
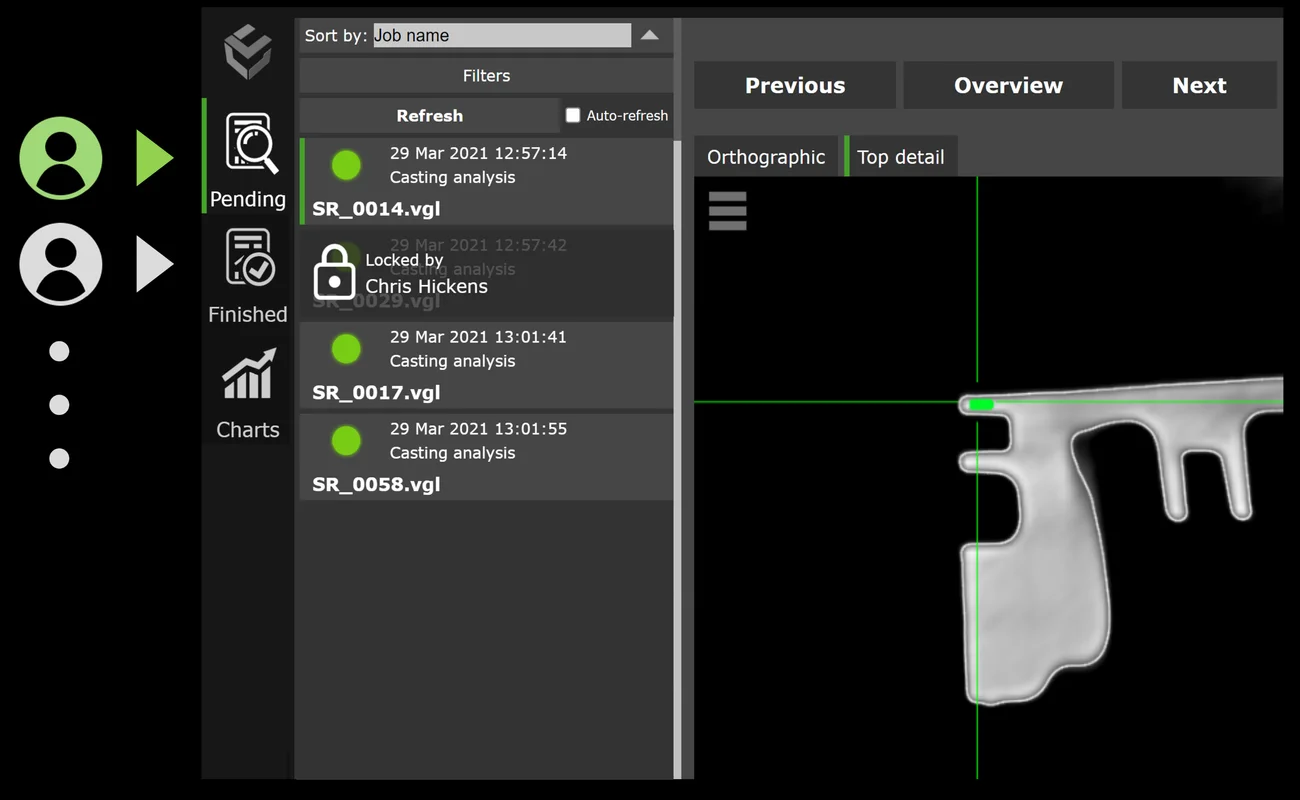
You can now access the VGinLINE APPROVER web application while other users are also working with it. Multi-user support improves your general efficiency by removing the need for coordination between users and increasing throughput through parallel work in the system.

Auto-Refreshing Lists in VGinLINE APPROVER
Auto-refresh for lists in VGinLINE APPROVER provides a continuously updated overview of pending and finished results, surfacing new results as they are added without requiring the user to manually refresh the list.

CT Reconstruction
List of Angular Manipulator Positions
For improved image quality, it is possible to use actual angular positions of the scanned object in automated reconstruction via Project SDK in version 3.4.3 and higher.

*Depending on the platform, there are differences in the range of functions for different operating systems. See our continuously updated Product Information page for details.
Volume Graphics GmbH
Speyerer Straße 4-6
69115 Heidelberg
Germany
Phone: +49 6221 73920 60
Fax: +49 6221 73920 88
Sales enquiries:
sales@volumegraphics.com
Modifications and errors reserved.
